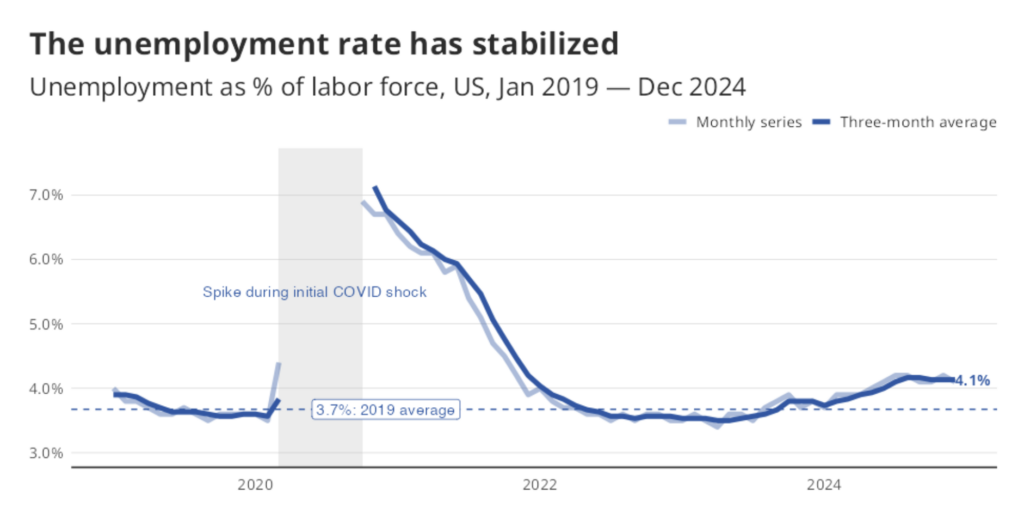
Approximately 4.6 million American workers are currently working part-time but would like full-time work. These workers are working part-time either because they couldn’t find full-time jobs or their hours were reduced. In September 2018, they accounted for roughly 2.9% of the US labor force—roughly the same proportion as in 2007, before the Great Recession. By comparison, in 2000, the involuntary part-time share of the labor force was 2.2%, over a half percentage point lower.
Of course, there are no guarantees that workers who would like full-time work will get the additional hours they want. In fact, the rate at which these workers are getting full-time work—defined as 35 or more hours a week—is lower than it was during comparable labor markets. Similarly, although the rate at which involuntary part-time workers are staying part-time is declining as the labor market gets stronger, that rate continues to be elevated.
There is good news though. The rate at which involuntary part-timers have moved to full-time status has been rising as the labor market has tightened. The strong labor market is providing more full-time opportunities for workers and it appears it will continue to do so.
Workers moving from involuntary part-time to full-time status are not primarily doing so by switching jobs. About 94% of these workers are moving to full time by finding additional hours with their current employers. In fact, among this group, the rate of moving to new full-time jobs hasn’t increased over the current expansion.
In other words, the labor market may be tight, but the still-substantial ranks of the part-time unemployed should give us pause in thinking it can’t get any tighter.
Part-time workers less likely to get a full-time job than in the past
The headline unemployment rate gives the impression that the labor market is now stronger than it was before the Great Recession and roughly the same as the very robust period of the late 1990s and early 2000s. But looking at involuntary part-time workers, which the US Bureau of Labor Statistics refers to as those “working part-time for economic reasons,” tells a different story. Trends in the rates at which these part-timers are moving to full-time work or staying part-time suggest the labor market still has some slack.
Let’s compare the labor market of June 2018 with two similar periods. In June 2018, the involuntary-part-time share of the labor force was 2.9%, its lowest level since November 2007 when it was also 2.9%. But, in November 2007, part-time workers found full-time hours at a 34% rate, considerably higher than the June 2018 rate of 30%.
We see something similar when we compare June 2018 with December 2000. In both months, the unemployment rate was similarly low, but, in December 2000, the rate of moving to full-time work was 37%, much higher than in June 2018.
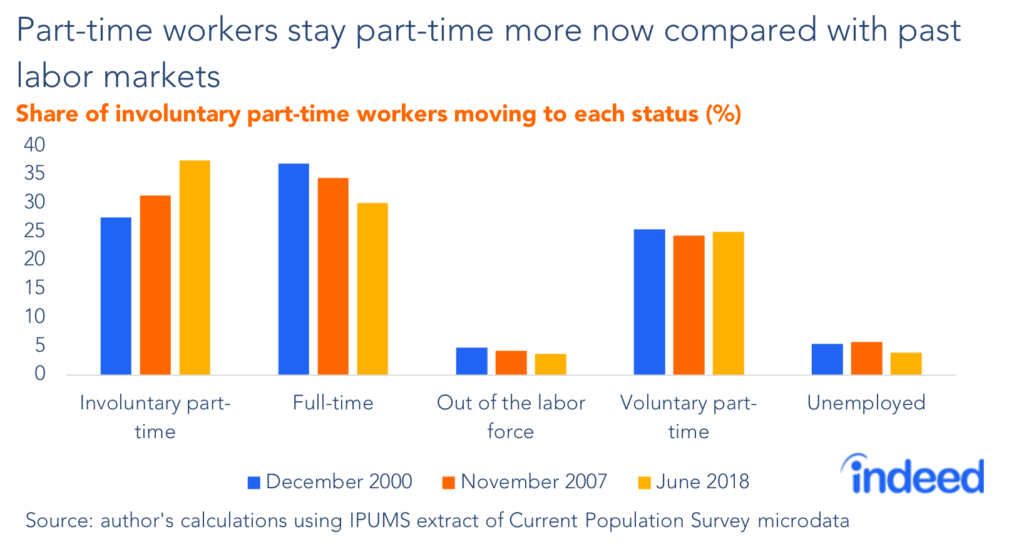
Workers are increasingly flowing to full-time work and out of part-time positions
While the rate that part-time workers are getting full-time work is lower than in previous periods, it is clearly increasing as the labor market tightens. The rate at which involuntarily part-time workers move into full-time work has been steadily rising for over four years. In January 2014, about 25% of those working part-time for economic reasons moved into full-time work. By June 2018, that rate had risen to roughly 30%.
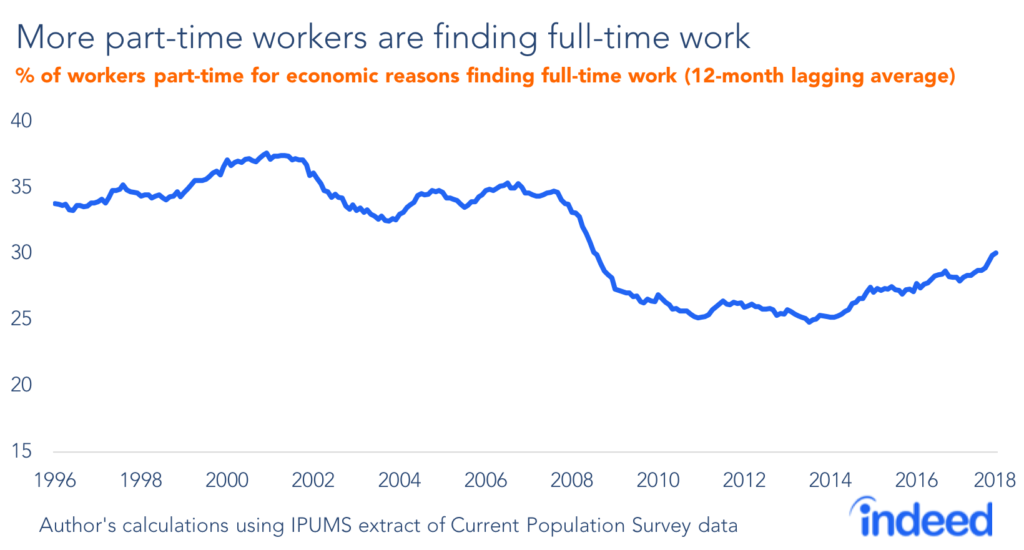
A rising rate indicates that employers are drawing from the pool of part-time workers as the ranks of jobless workers decline. Looking back further, the rate of movement to full-time work also increased as labor markets tightened during the late 1990s and mid-2000s. A rate that is both rising and below previous peaks suggests the rate can get back to earlier levels. If part-time workers were able to move to full-time status at these rates before, it seems likely that, if the labor market continues to strengthen, many more workers will be able to get full-time work.
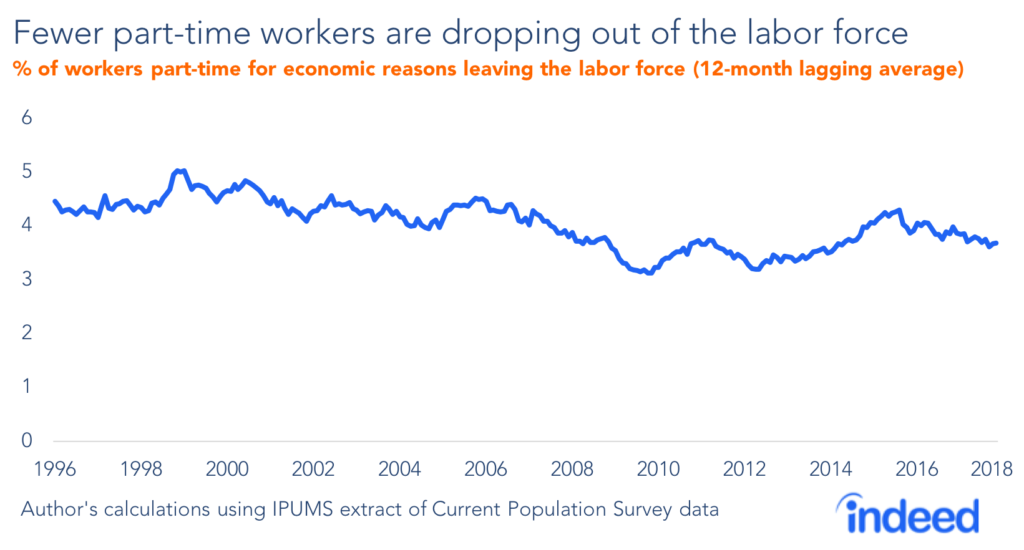
A look at the rate at which those working part-time for economic reasons are dropping out of the labor force altogether offers additional evidence that a stronger labor market can get more workers out of part-time status. The decline in the number of involuntary part-time workers isn’t because more part-time workers are leaving the labor force. The drop-out rate among part-timers has been fairly steady during this economic expansion and is currently very close to its average for the whole period.
Part-time workers don’t appear to be switching jobs more often
How are part-time workers getting full-time jobs? It’s not from job hopping. The rate at which involuntary part-time workers move into full-time jobs with new employers hasn’t increased at the same pace as the increase in the rate of getting full-time work.
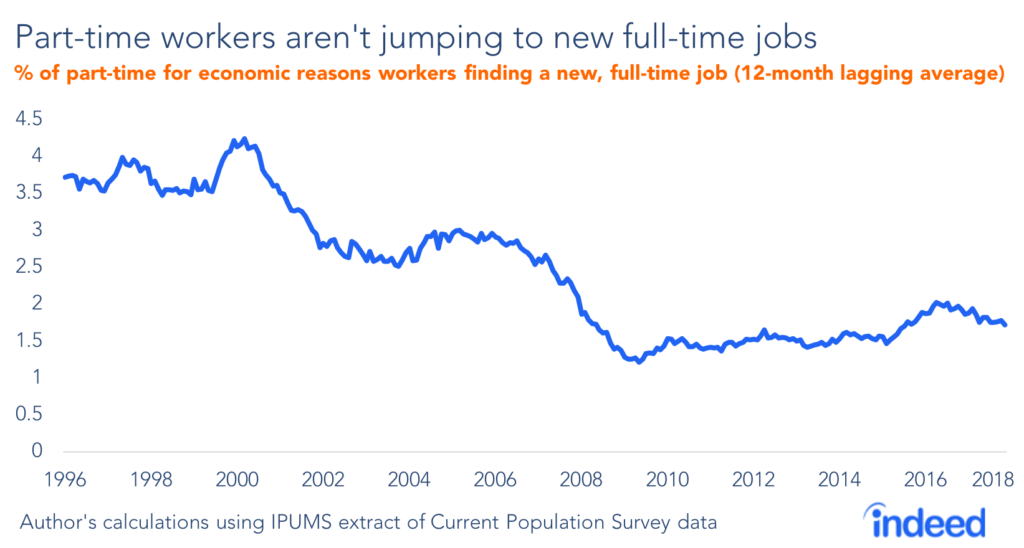
This flat trend is a result of an overall decline in job hopping among part-time employed workers. The decline in movement to new full-time jobs could be because part-time workers are switching jobs less frequently or because their next job is less likely to be a full-time one. But the data show that the share of part-time job switchers who end up with new full-time jobs has been fairly consistent over the past several years. When these workers switch jobs, they are just as likely to move into full-time positions as job switchers in the past.
The vast majority of those working part-time for economic reasons who get full-time hours are doing so without switching jobs. This was also true in the past. During the late 1990s and 2000, approximately 90% of moves into full-time did not involve job hopping. And, by June 2018, approximately 94% of moves to full-time involved workers getting additional hours with their current employers.
A bit more room to run?
The part-time-for-economic-reasons rate is roughly at pre-Great Recession levels and its decline shows no sign of slowing. However, although the rate at which those working part-time for economic reasons move into full-time work is rising, it is still below 2000 levels, when the unemployment rate was similar.
The rate of involuntary part-time workers finding full-time work has trended down overall since 2000, which one could interpret as the result of structural changes to the labor market. But other labor market indicators (like the unemployment rate) are back at 2000 (or earlier) levels, suggesting that the years since 2000 are not necessarily indicative of what we would expect the rate of workers finding full-time work to be in a tight labor market
With the number of vacant jobs now outnumbering unemployed workers, employers are looking to find hours from other supply sources. Underemployment and part-time work appear to be remaining sources of slack in the labor market. As other recent research has noted, this pool of available workers may be partly responsible for tepid wage growth in the US and abroad.
A stronger labor market seems to have pushed up labor force participation, that is, the proportion of the population working or actively looking for work. Similarly, continued labor market tightening should move more involuntary part-time workers into full-time jobs. These workers represent a remaining source of slack. That should give policymakers pause in concluding the US labor market has reached “maximum employment.” If that target isn’t hit, millions of workers will be working fewer hours than they’d like.
Methodology
We calculated the flows of part-time workers using the IPUMS harmonization of Current Population Survey data. Respondents to the survey were classified as part-time for economic reasons, full-time, unemployed, and not in the labor force, according to Bureau of Labor Statistics definitions.
Workers were marked as having switched jobs if they responded that they had a new job in the next month, according to the CPS data. This methodology for calculating hiring rates of already employed workers has been used in previous research, such as Fallick and Fleischman (2004) and Diamond and Şahin (2016).
Workers who are part-time for economic reasons may be more likely to drop out of the CPS that other kinds of workers which could skew our data when we merge them for a flows analysis. To account for this possible differential attrition, we recreated the share of the labor force that is part-time for economic reasons using our matched sample. The level and trend of this rate is very similar to the level and trend of a rate created from the full sample.
Due to sample size concerns, the flow rates cited in this piece and included in graphs are the 12-month trailing average. For example, the data for June 2018 is the average of July 2017 through June 2018.


