Key Points:
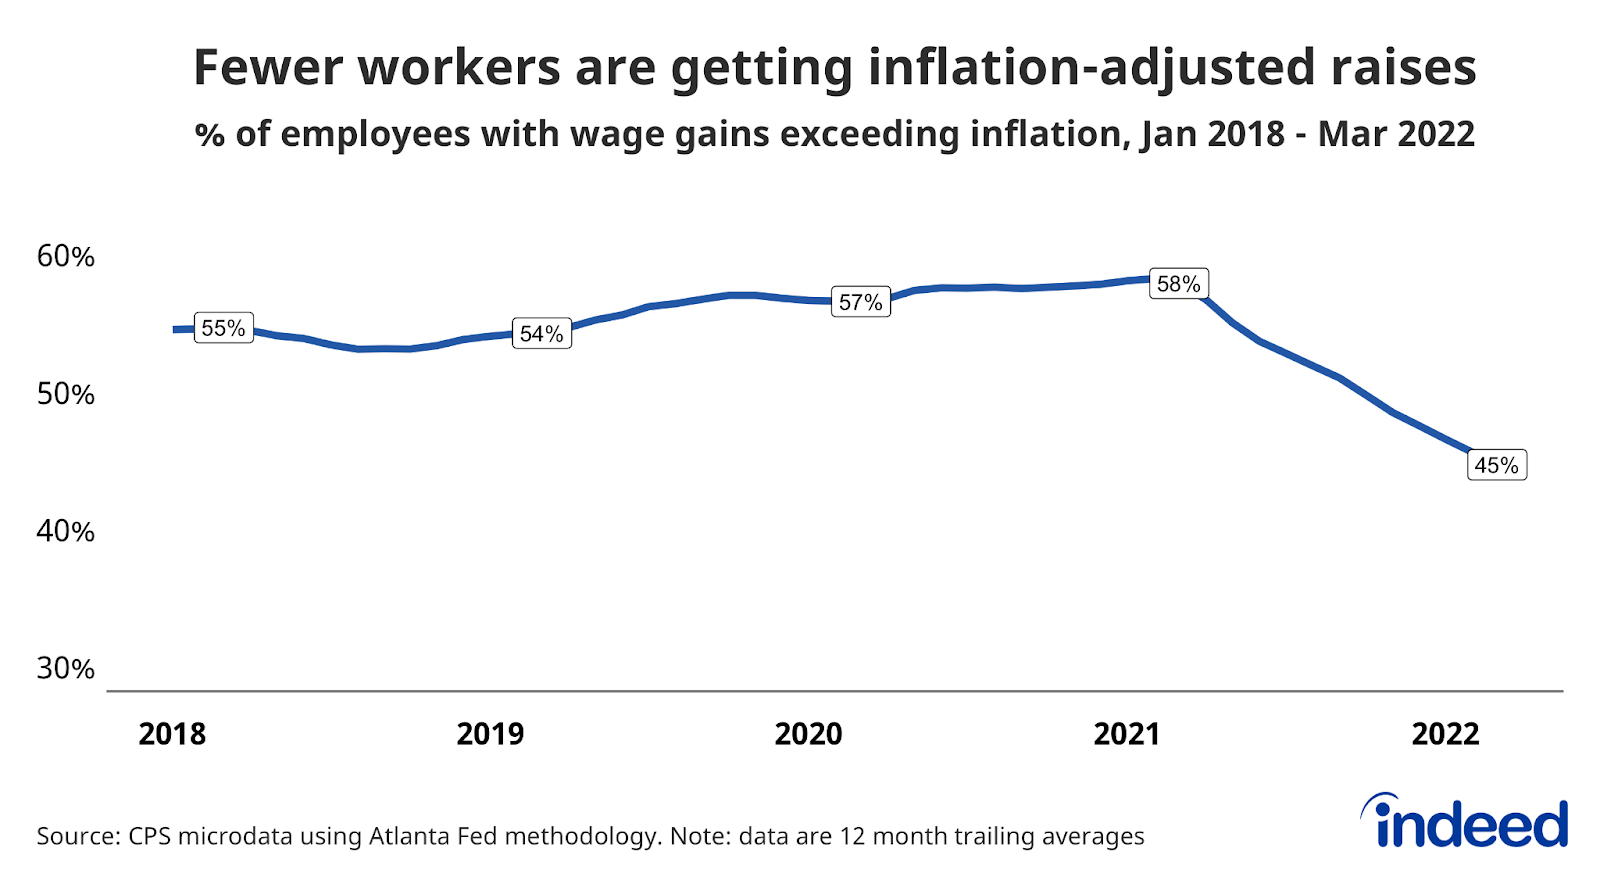
- Inflation is outpacing wage growth for most people, as the share of workers getting raises that more than offset higher prices fell to 45% in March 2022 from 58% a year prior.
- The US labor market remains hot as demand for workers outstrips worker readiness to take jobs.
- This imbalance is the root cause of the current strong wage growth, though inflation has diluted those gains.
- With elevated levels of employer demand, employment is recovering, though by some measures it has not returned to pre-pandemic levels.
Spotlight: Fewer Workers Are Getting Raises that Keep Up with Inflation
Wages are growing quickly these days, but so are costs. After accounting for the rise in consumer prices, the average wage in the US in March was lower than it was a year earlier. However, that begs the question of how individual workers are faring. This research post tracks how many workers are seeing wage gains that exceed inflation and how many are losing ground, using the methodology of the Atlanta Federal Reserve Bank’s Wage Growth Tracker (see Methodology).
In March, about 45% of workers saw their wages grow over the past year after adjusting for inflation. But that’s down from the roughly 58% whose wages were growing faster than inflation in March 2021. This 13 percentage point drop in the share of workers getting an inflation-adjusted raise may explain why many Americans are feeling gloomy about the labor market and the broader economy despite rapid growth.
But let’s keep things in perspective: It is remarkable that more than 40% of workers are getting inflation-adjusted raises despite consumer prices jumping over 8% on an annual basis. That speaks to how strongly the imbalance between labor supply and demand is driving up wages.
The drop in the share of paychecks growing faster than inflation raises poses some risks for the short-term labor market outlook. With fewer raises outpacing inflation, consumer purchasing power may decline and some households may spend down savings. The labor market has quite a bit of momentum, but a slowdown or actual decline in household spending could cool it down.
Labor Market Overview
The US labor market remains hot. As the US economy has bounced back from the initial COVID-19 shock, demand for labor has grown much more quickly than supply. Employment has rebounded, wages are growing fast, and joblessness is approaching pre-pandemic levels. Nevertheless, this momentum faces potential roadblocks in the form of quickly tightening monetary policy, geopolitical instability, and new variants of COVID-19.
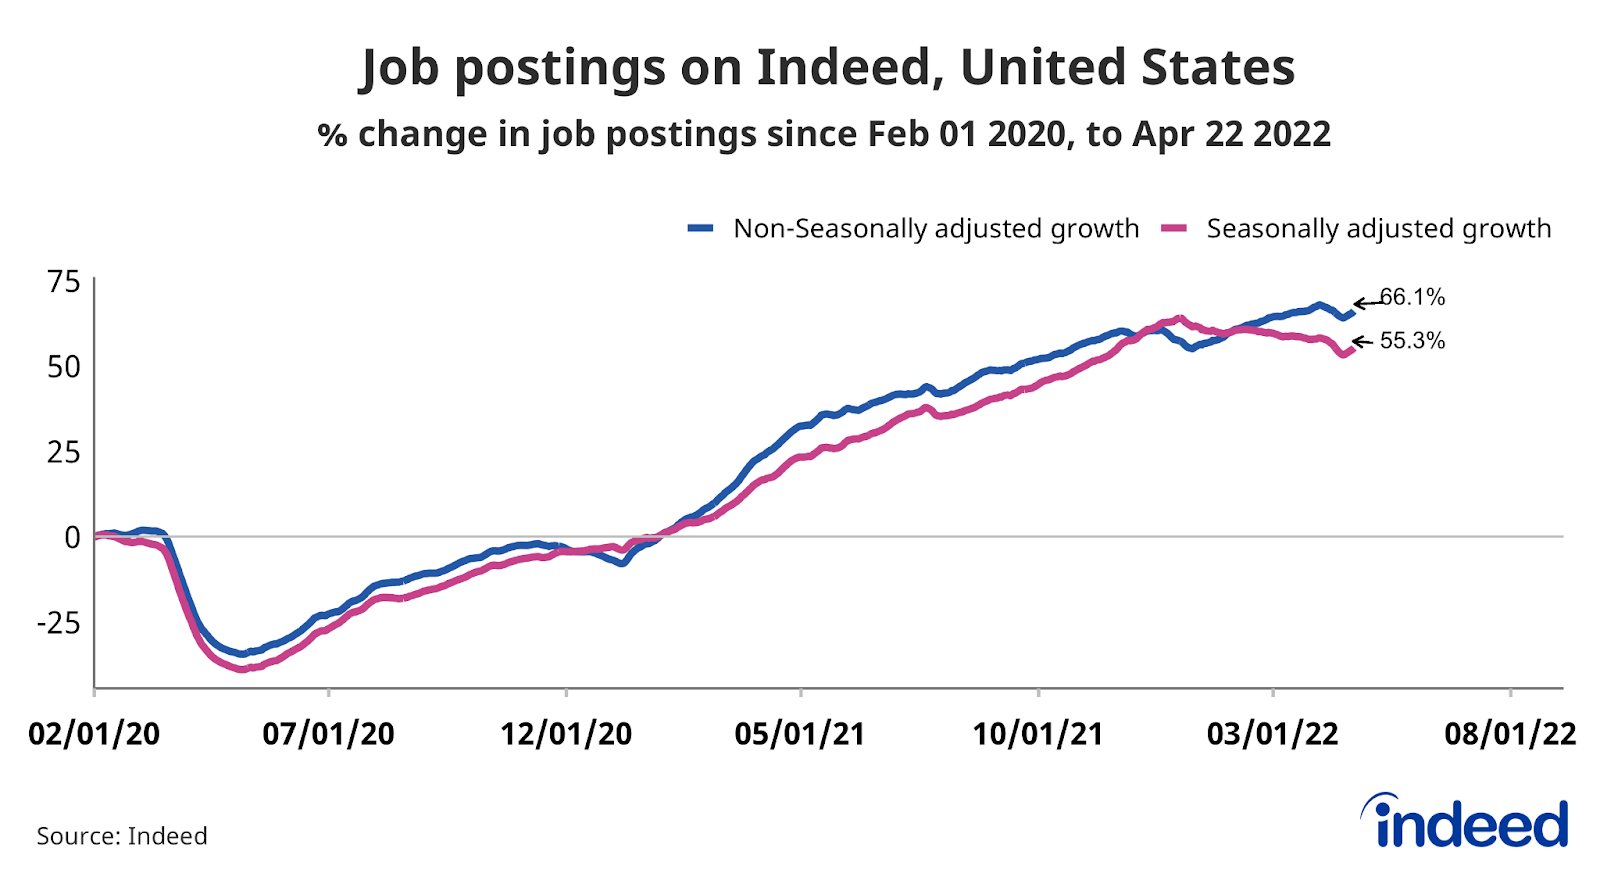
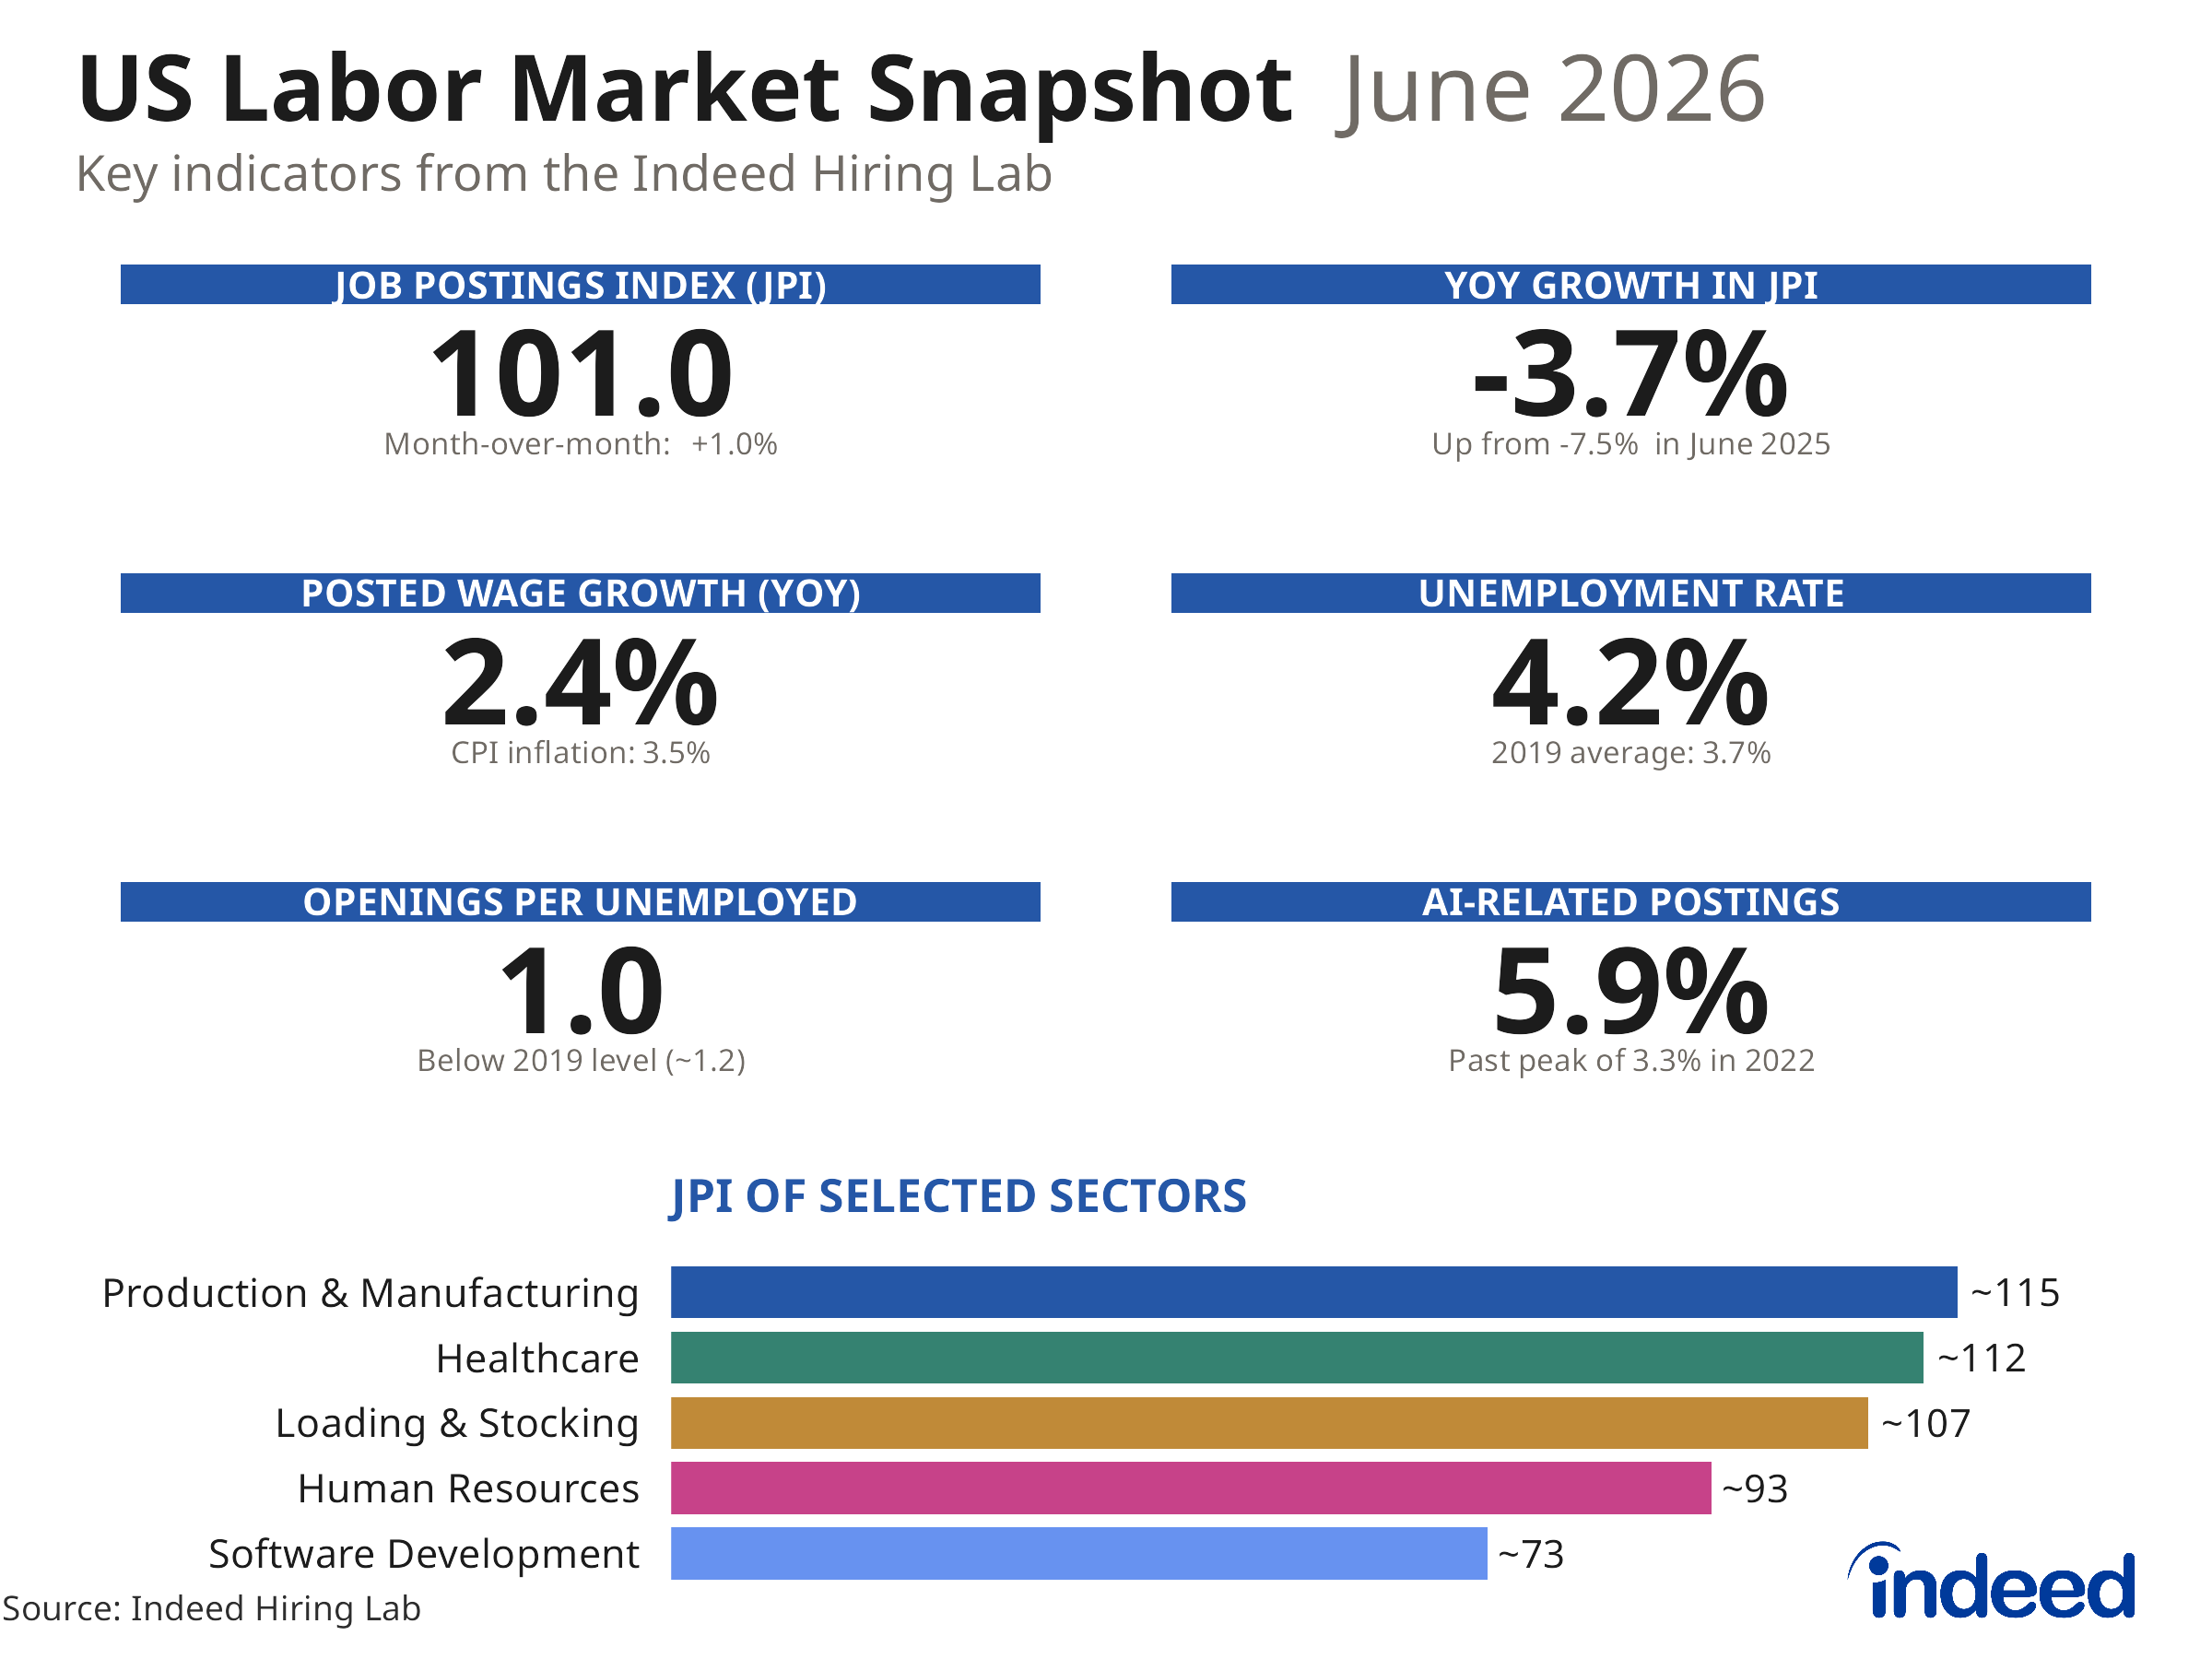
Employer demand for workers remains strong, with Indeed job postings as of April 22, 2022 55.3% above their pre-pandemic baseline. But overall growth in labor demand has slowed in recent months. In fact, job postings have fallen in recent weeks, a trend we’ll be watching carefully. Still, occupational sectors vary widely. Ads for human resources jobs were 118% above their pre-pandemic baseline, but postings in low-advertised-wage occupations grew more slowly.
Strong wage growth, but inflation is eating away gains
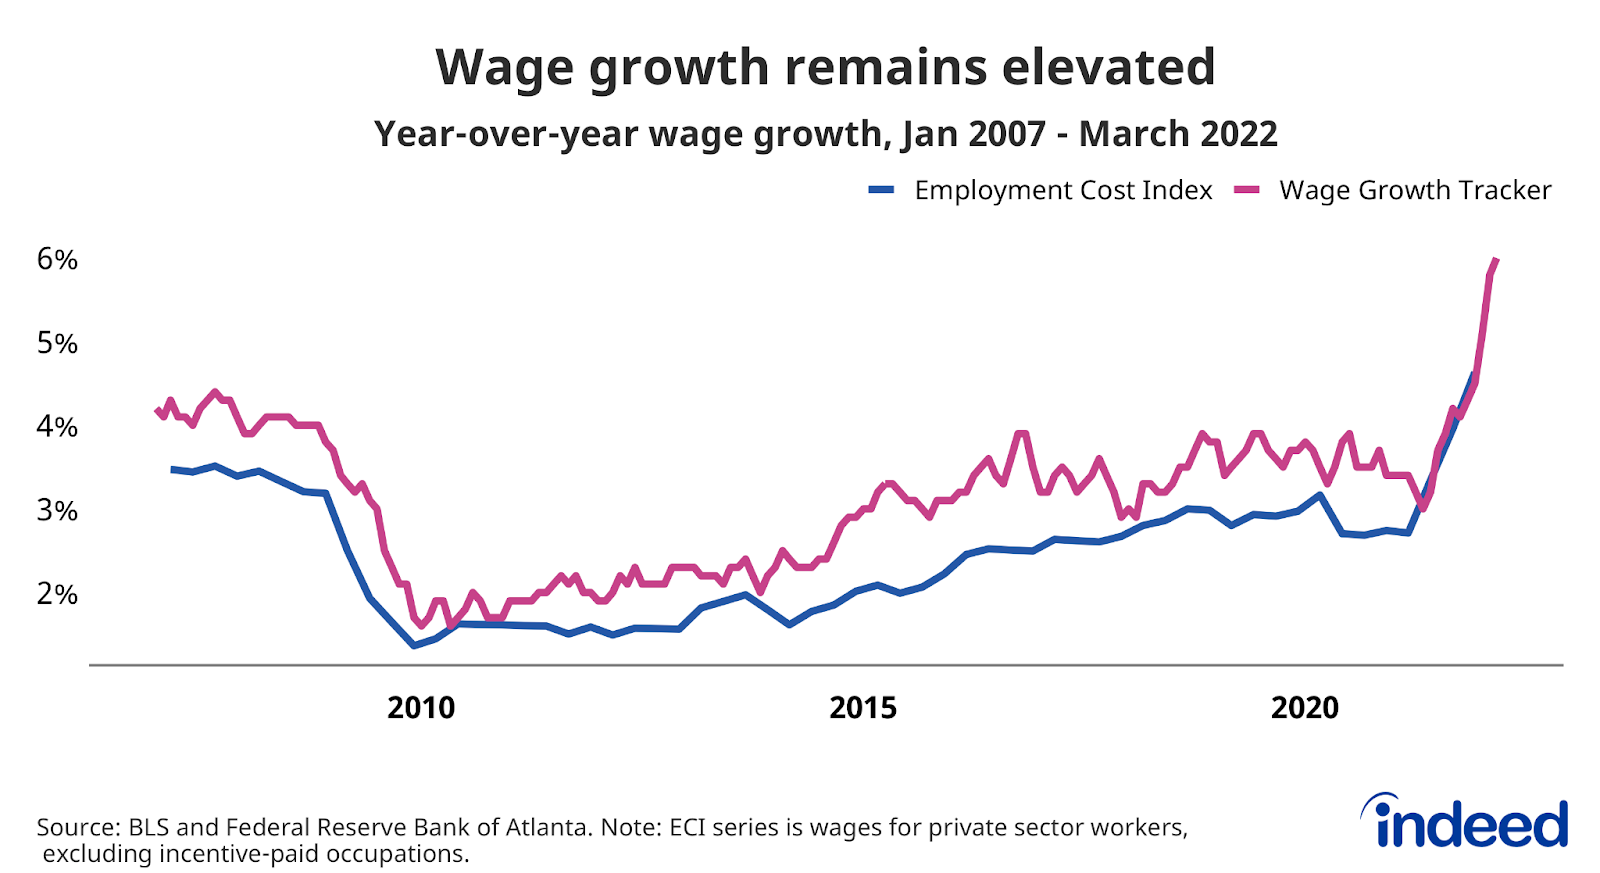
Strong demand for workers combined with acute hiring difficulties across multiple sectors has driven wages up roughly 6% on an annual basis, a higher growth rate than at any point in over the past 20 years. This is what economists call nominal wage growth, that is, pay gains before taking inflation into account. Rising prices are eating away those gains and causing many employees to lose ground when it comes to actual purchasing power.
One of the biggest questions for the US economy is whether this high nominal wage growth can be sustained. There are signs this growth is starting to ebb as it becomes easier for employers to find workers in some fields. If this continues, the rate at which employers bid up wages might temper. Should that occur, inflation would have to drop substantially to keep even more workers from falling behind.
People of prime working age are returning to work
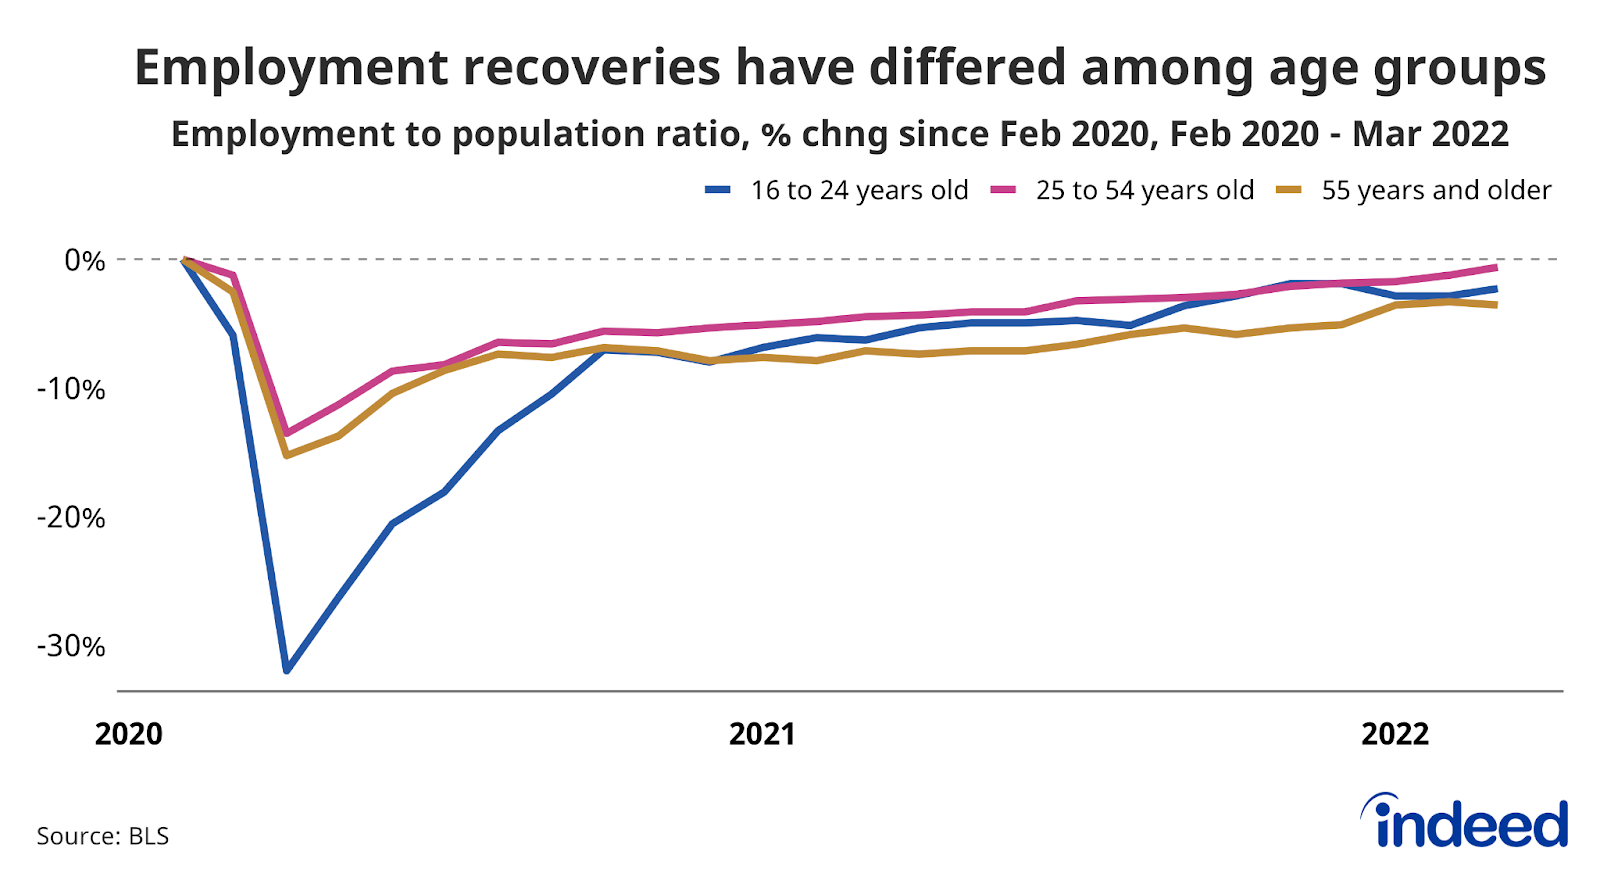
Labor supply has not grown as swiftly as demand, but, overall, people are returning to work. Some labor supply measures have been sluggish, including the rate of participation in the labor force and the percentage of the working age population that’s employed. In fact, if you take into account the aging of the population, which means a larger share of the public is no longer of prime working age, the rebound in labor supply has been solid. When we focus on people from 25 to 54, which economists consider the prime working years, we see much stronger growth in employment and labor force participation. Meanwhile, a continued pickup in so-called ‘unretirements’, or retirees returning to work, would strengthen employment recovery among older workers.
The rise in urgent job search is muted
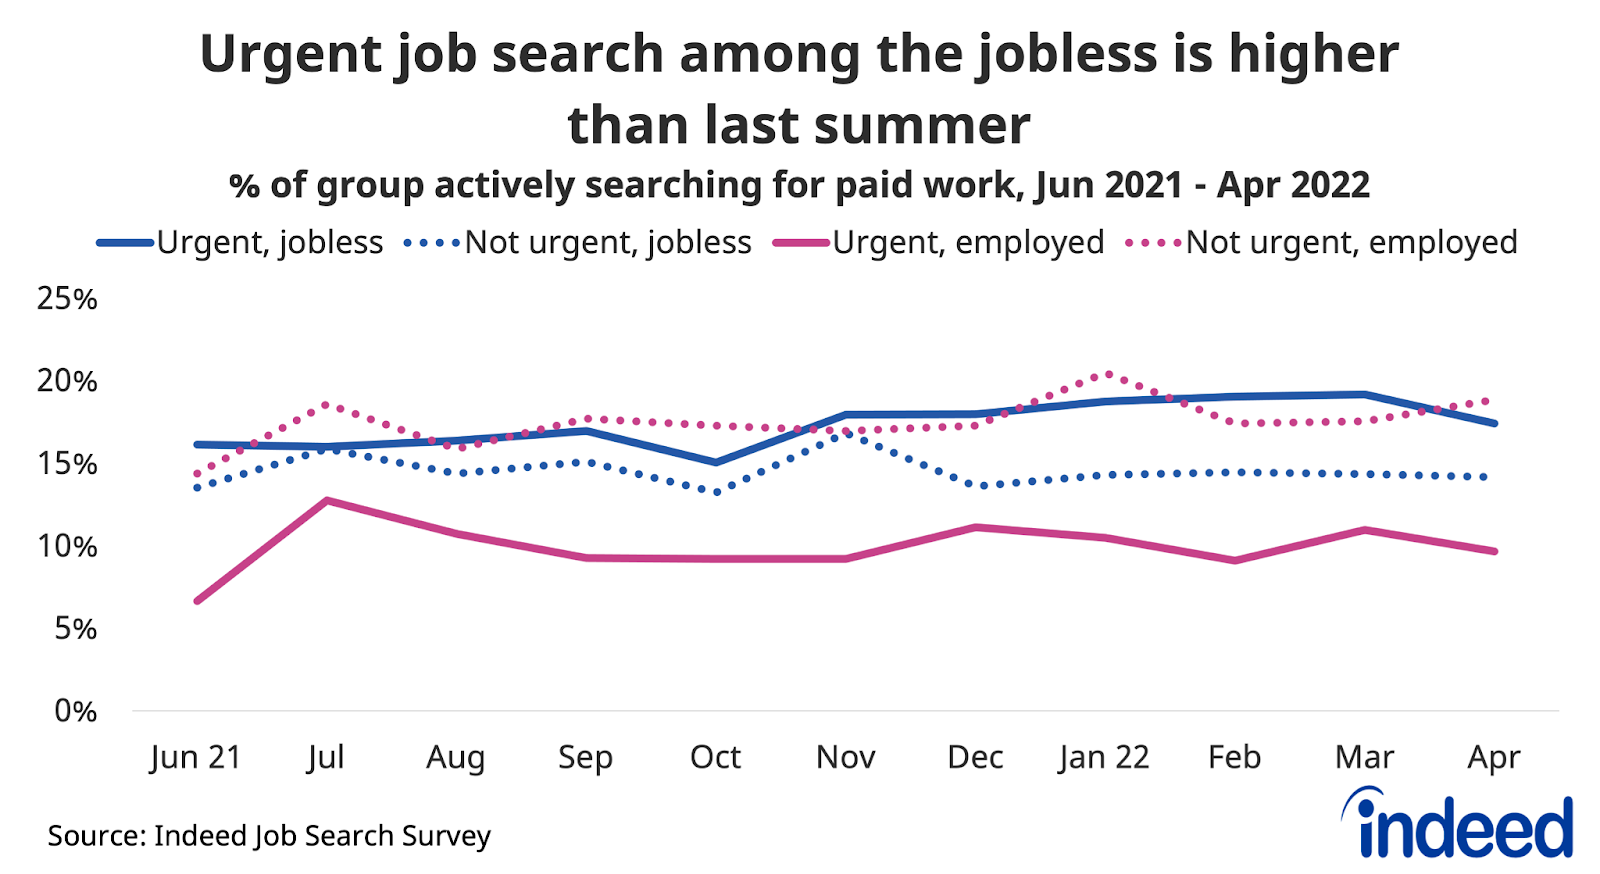
Many people are taking new jobs. But job seeker urgency to find work has been relatively muted, according to data from our most recent Indeed Hiring Lab Job Search Survey. More workers are reporting they are searching urgently, but the increase is far slower than the rebound in jobs. The rise in employment is being driven by workers enticed into jobs rather than by those who feel a compelling need to find new work.
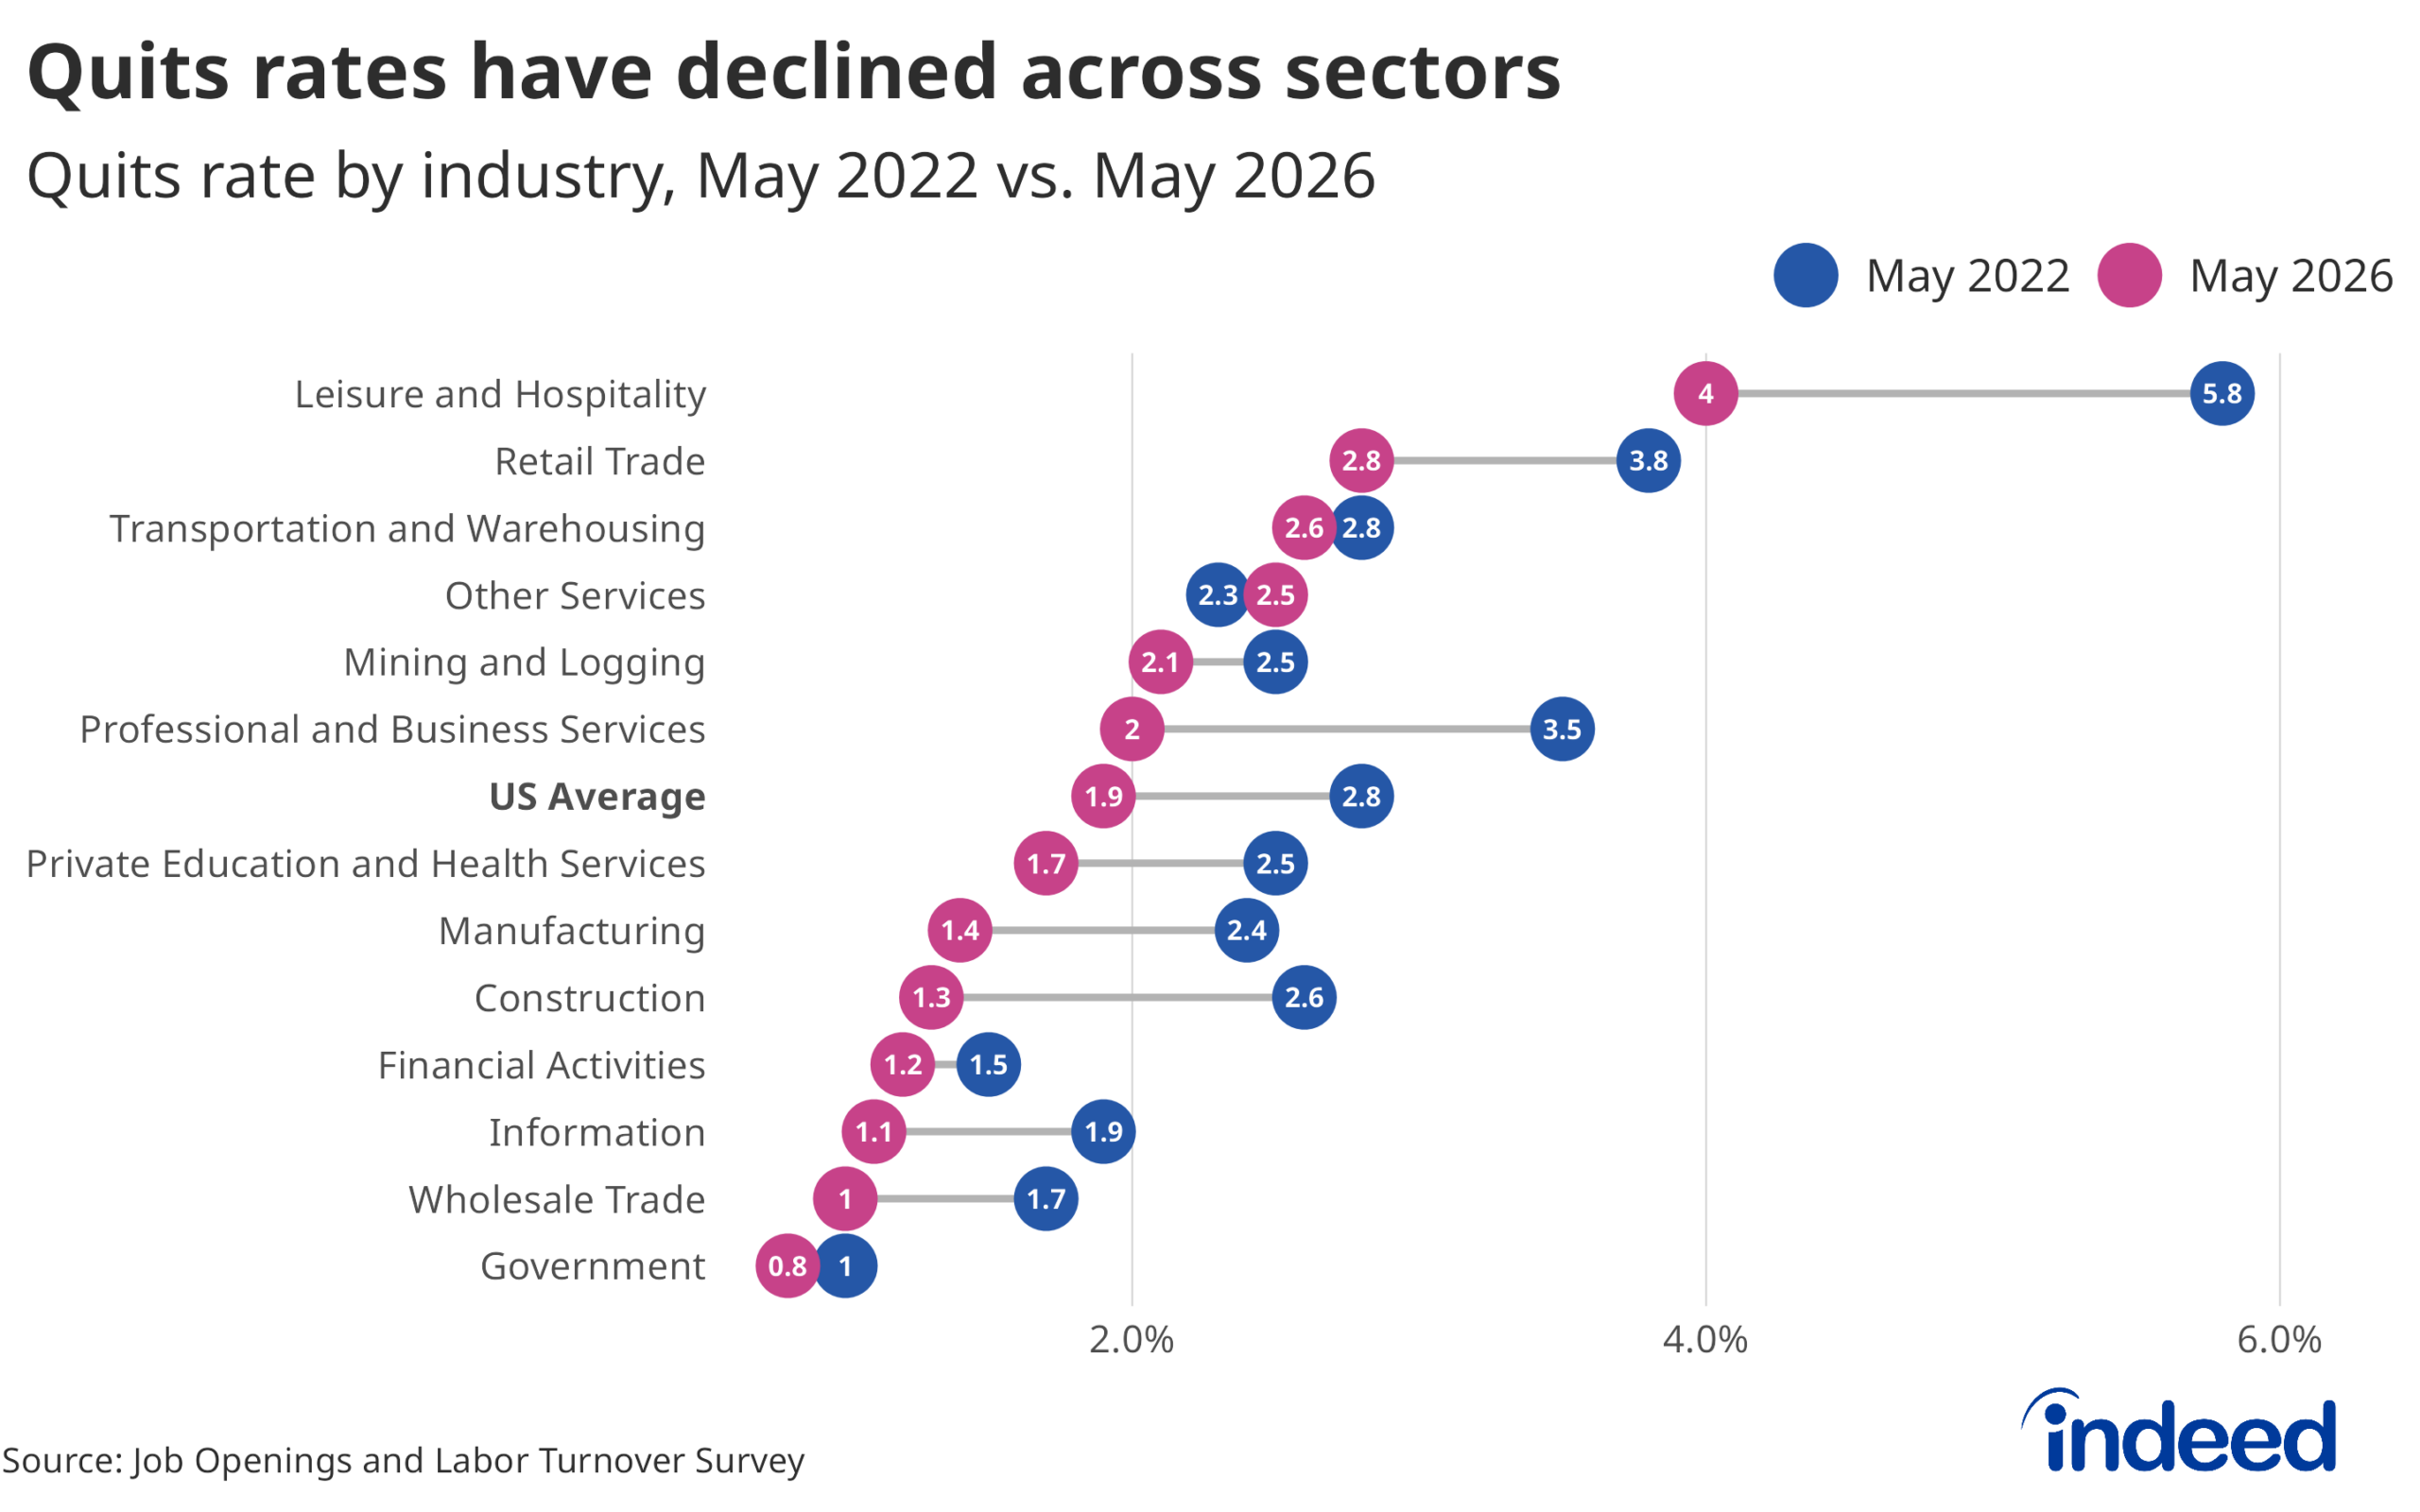
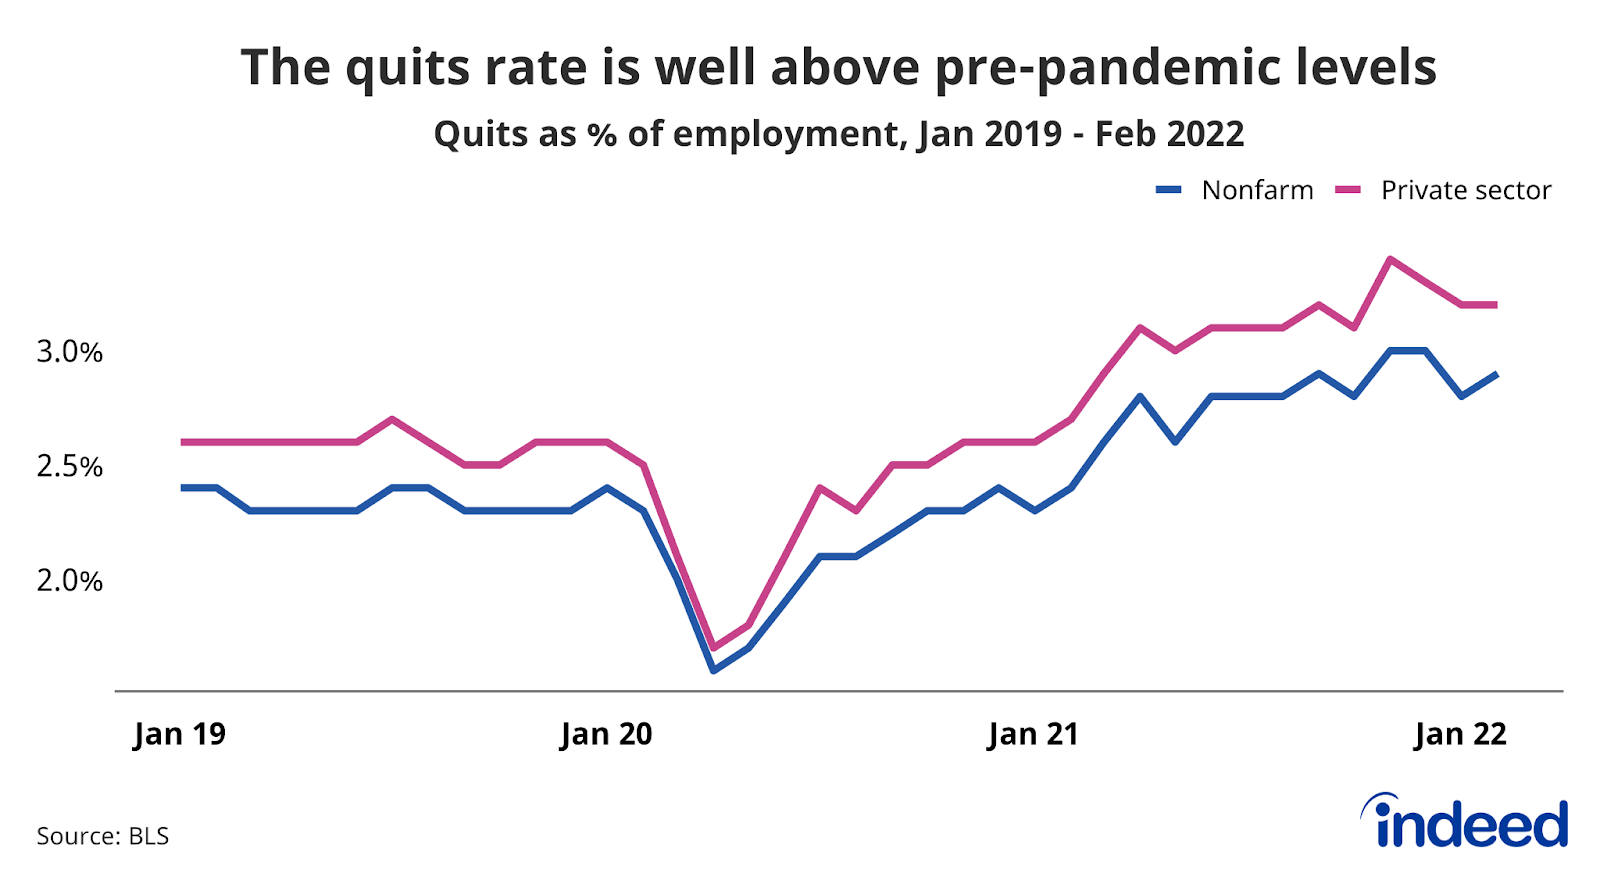
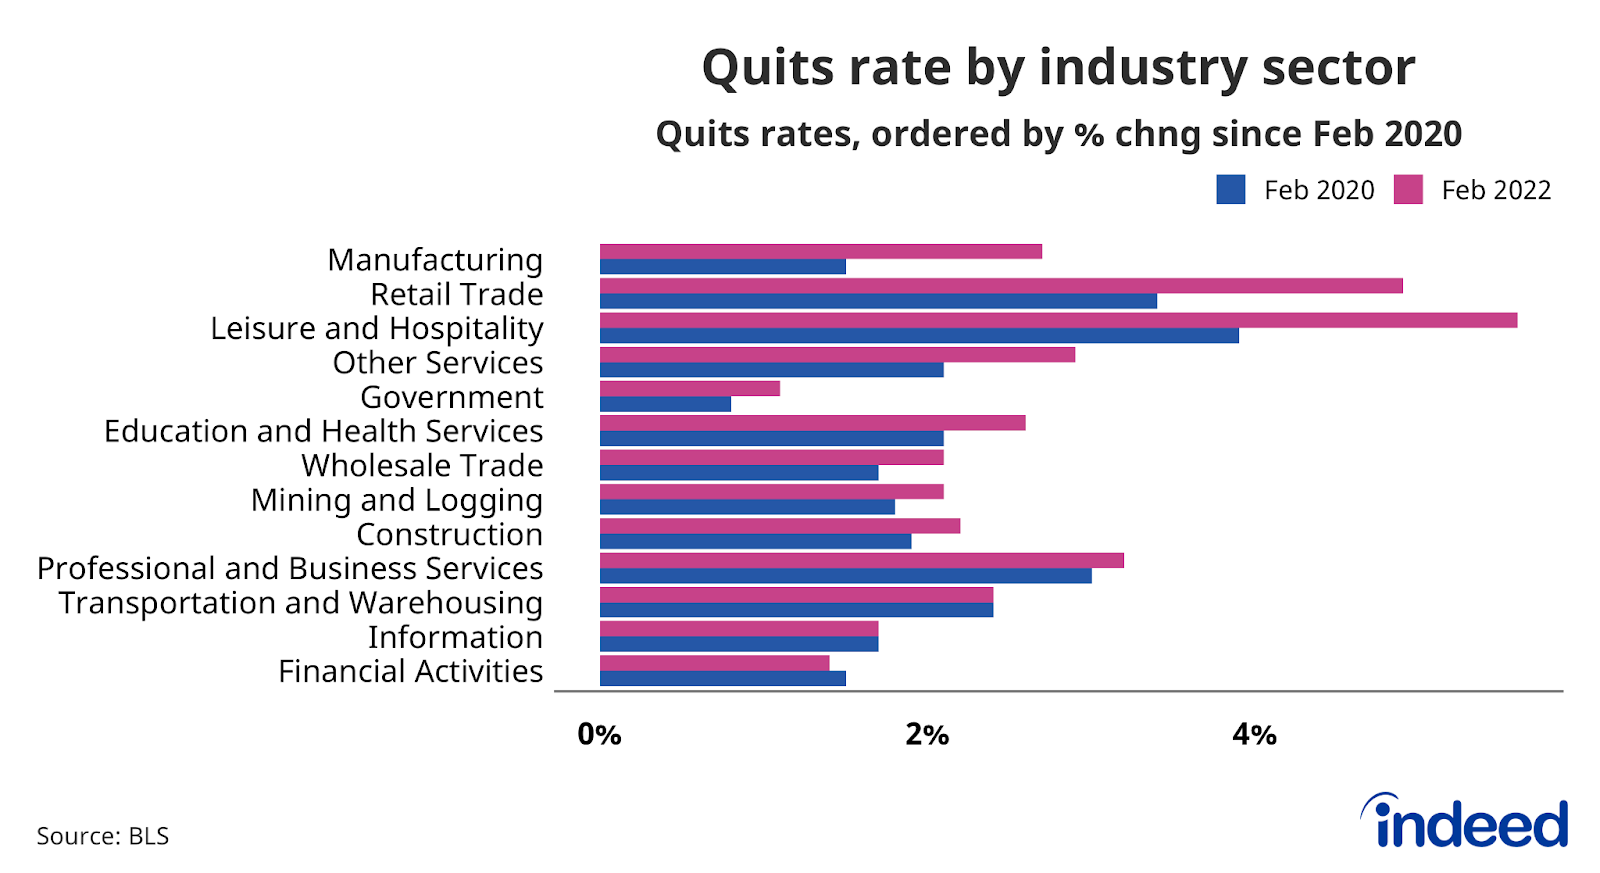
Workers are quitting jobs at a high rate
Employed workers are also finding new work, pushing the rate of job quitting to levels not seen in the 21st century. A remarkable 3.2% of private sector workers voluntarily left their jobs in February 2022. This high volume of quitting reflects strong demand for workers and is concentrated in lower average-wage industry sectors such as manufacturing, leisure and hospitality, and retail trade.
The US labor market has been offering plenty of opportunities for workers while presenting some challenges to employers. However, the present situation undoubtedly will change. We will continue to monitor these trends and track others as the labor market evolves.
Methodology
The analysis of the prevalence of inflation-adjusted wage gains was done using an extract of Current Population Survey microdata from the Center for the Advancement of Data and Research in Economics at the Federal Reserve Bank of Kansas City. CADRE allows users to download a version of the microdata cleaned and prepared according to the methodology of the Federal Reserve Bank of Atlanta’s Wage Growth Tracker. For more information on the methodology of the Wage Growth Tracker, see the Atlanta FRB website.
Our analysis counts individuals as having received inflation-adjusted raises if their year-over-year wage growth exceeded the year-over-year change in the CPI-U price index for that same month. We calculate the share of all employed workers with an inflation-adjusted raise each month and then calculate a trailing 12-month average to smooth out the data.
Data on seasonally adjusted Indeed job postings are the percentage change in seasonally adjusted job postings since February 1, 2020, using a seven-day trailing average. February 1, 2020, is our pre-pandemic baseline. We seasonally adjust each series based on historical patterns in 2017, 2018, and 2019. We adopted this methodology in January 2021. Data for June 24-30, 2021; November 1, 2021; January 1, 2022; January 27, 2022; and January 28, 2022, are missing and were interpolated. Non-seasonally adjusted data are calculated in a similar manner except that the data are not adjusted to historical patterns.
The number of job postings on Indeed.com, whether related to paid or unpaid job solicitations, is not indicative of potential revenue or earnings of Indeed, which comprises a significant percentage of the HR Technology segment of its parent company, Recruit Holdings Co., Ltd. Job posting numbers are provided for information purposes only and should not be viewed as an indicator of performance of Indeed or Recruit. Please refer to the Recruit Holdings investor relations website and regulatory filings in Japan for more detailed information on revenue generation by Recruit’s HR Technology segment.
The data from the Job Search Survey is based on 11 online surveys of 5,000 US adults ages 18-64 starting in late May 2021 and continuing through March 2022. The first survey was conducted May 26-June 3, the second July 12-20, the third August 10-18, the fourth September 13-29, the fifth October 11-20, the sixth November 8-18, the seventh December 6-22, the eighth January 10-24, the ninth February 7-21, the tenth March 7-21, and the most recent April 11-23. Weights were applied to each survey to match respondent distributions across age, educational attainment, race/ethnicity, and sex with the 2020 Current Population Survey’s Annual Social and Economic Supplement.