
Key points:
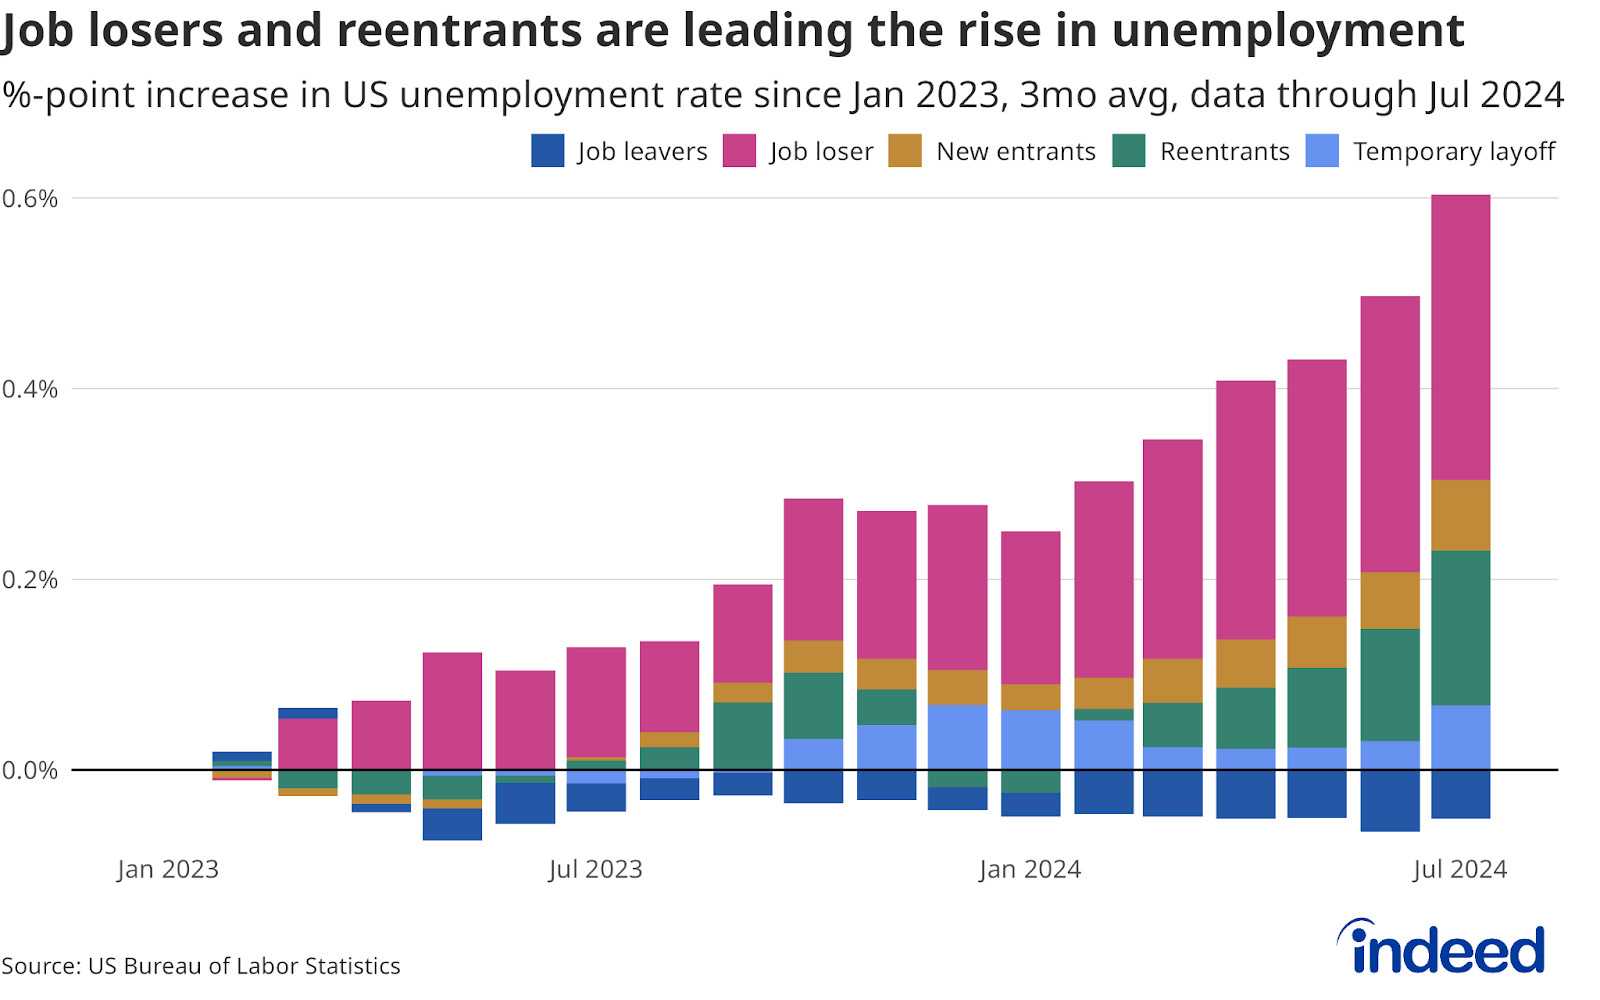
- The unemployment rate has risen 0.55 percentage points on a three-month average basis since its low of 3.5% in January 2023, raising recession fears.
- Much of the increase in unemployment has been driven by workers joining or re-joining the labor force, a sign that workers remain confident in their ability to eventually find work.
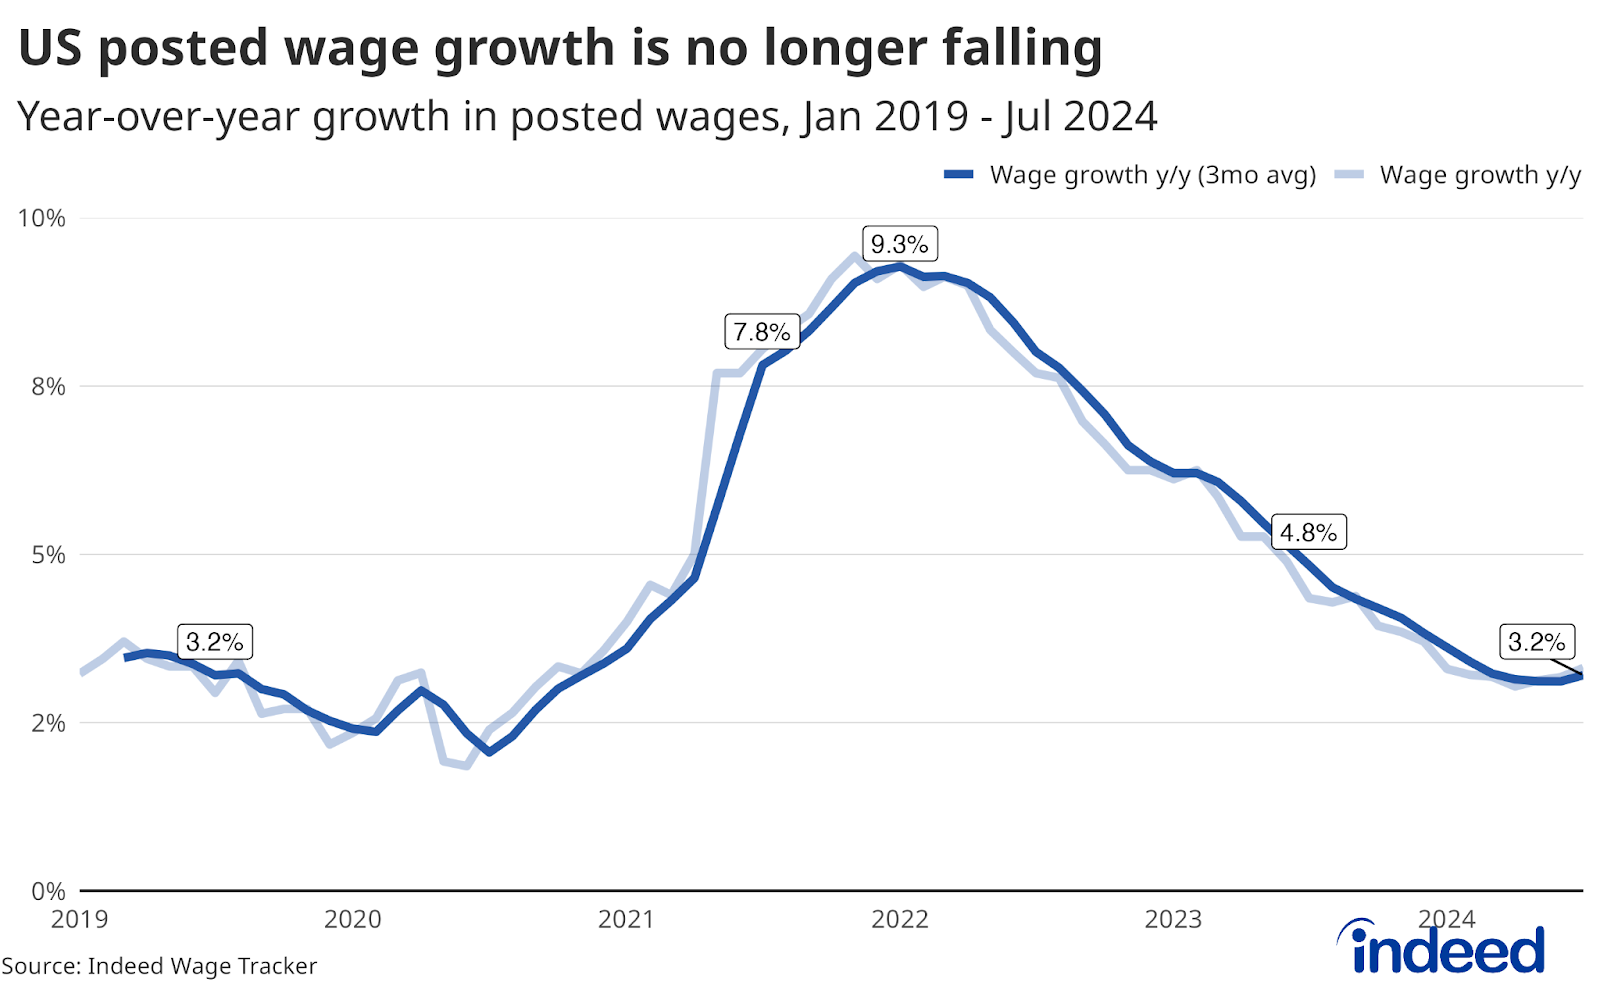
- Persistent wage growth is likely to draw more workers back to the market and will continue to do so if it stays strong, a reason for cautious optimism that outright labor market deterioration may not be immediately at hand.
Our monthly Labor Market Update examines important trends using Indeed and other labor market data. Our US Labor Market Overview chartbook provides a more comprehensive view of the US labor market. Data from our Job Postings Index — which stands 13% above its pre-pandemic baseline as of August 16 — and the Indeed Wage Tracker are regularly updated and can be accessed on our data portal.
After a years-long stretch in which the US labor market seemed virtually invincible, fears about its health have begun piling up in recent months. July’s jump in the unemployment rate and the triggering of a well-known recession indicator initially seemed to signal that the steady moderation that has characterized the labor market for the past few years may quickly be shifting to outright deterioration. But a deeper look into the data suggests that while the rising unemployment rate can’t be ignored, the forces behind the recent increase suggest it’s unlikely to immediately turn into a surge.
On a three-month average basis, the unemployment rate has risen 0.55 percentage points since its low of 3.5% in January 2023. More than half of that increase (0.3 percentage points) has been driven by workers who report losing their jobs. But another 0.23 percentage points comes from new entrants or reentrants — people joining the labor force for the first time or coming back to it. It is generally less worrisome when unemployment is driven up because more workers are choosing to join the labor force because it suggests workers have some confidence they will find work and are actively seeking a job.
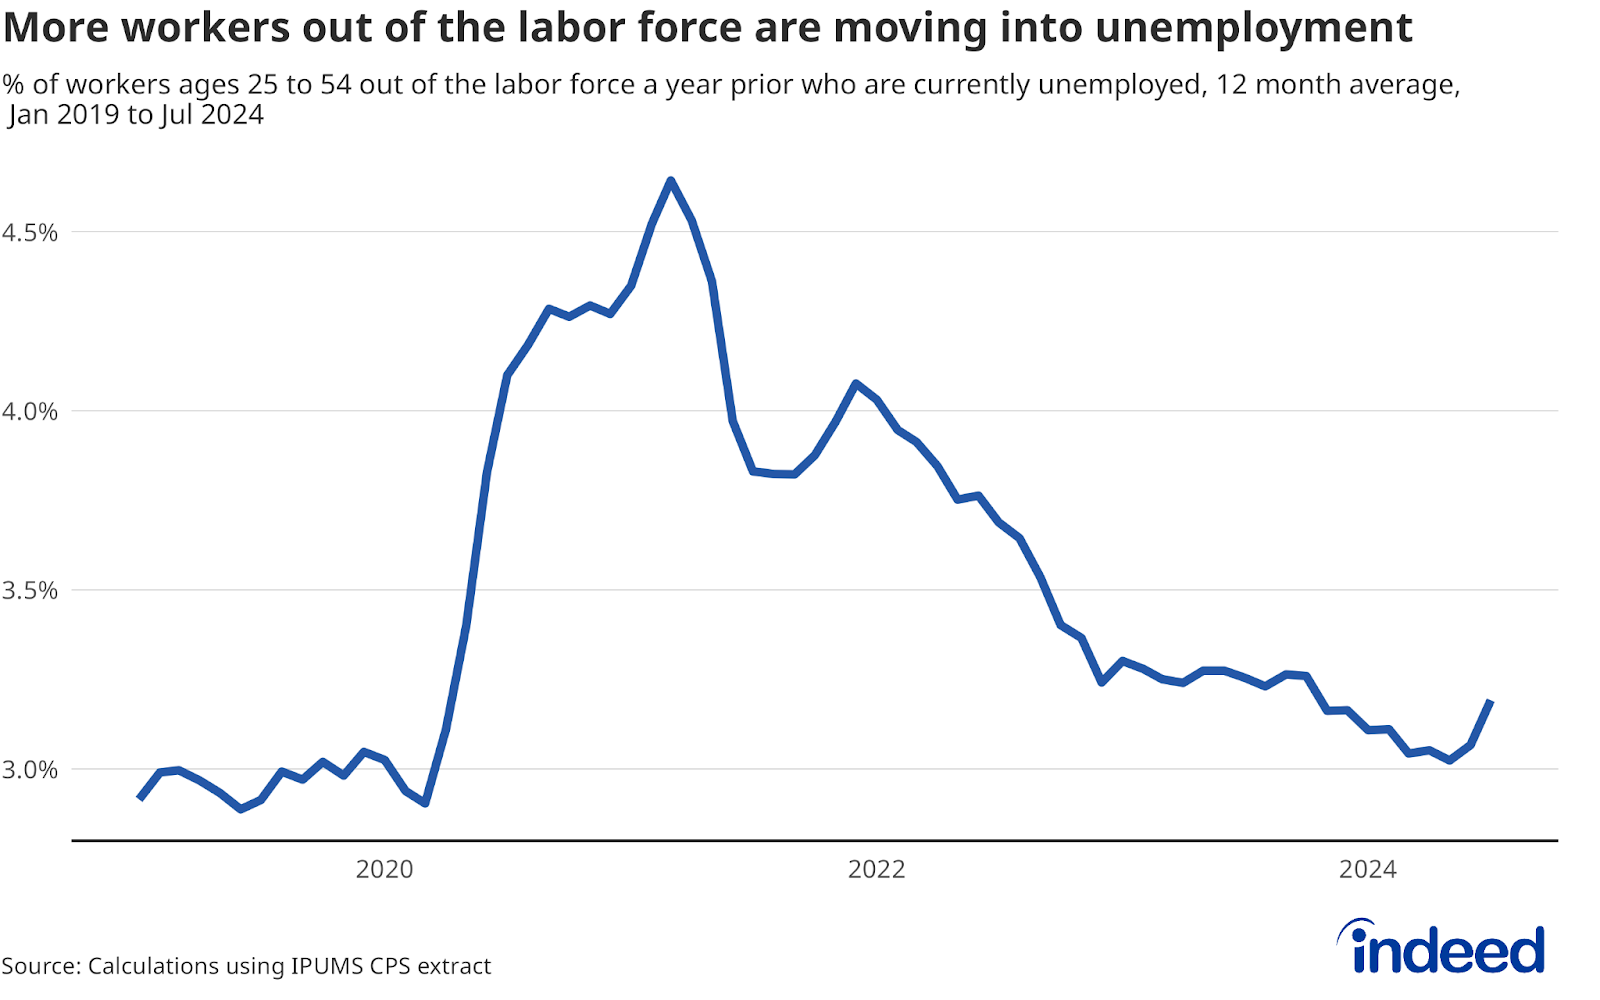
There’s additional evidence that workers are joining the labor force, albeit as part of the ranks of the unemployed. Workers in their prime working years (ages 25-to-54) who were out of the labor force have been entering unemployment at an increasing rate in recent months. This rate dropped during the early days of the 2001 recession, so the increase of late may be a sign the labor market retains some strength. Fewer workers joining the labor force via unemployment as the unemployment rose would be a sign that workers had a negative outlook for their job-finding prospects
Job seekers who are new to or returning to the market after some time away will still find a good number of jobs that need filling. The Indeed Job Posting Index stood at 113 in mid-August, meaning the number of job postings was 13% higher than it was on the eve of the pandemic. And after falling slowly but steadily after peaking in early 2022, the decline in job postings appears to have leveled off and has hovered roughly between 10% and 15% higher than pre-pandemic norms since mid-May.
In addition to a relative abundance of job opportunities, another factor that may be drawing workers back to the labor force in greater numbers is persistently strong wage growth, which has slowed from recent highs but remains on par with pre-pandemic levels. In the face of a materially deteriorating labor market, we might expect wage growth to diminish further. Instead, posted wage growth has remained steady at between 3.1% and 3.2% since March. This ongoing strength in wage growth may continue to lure new entrants to the market in coming months, potentially pushing the unemployment rate higher, but for less troubling reasons than the usual causes.
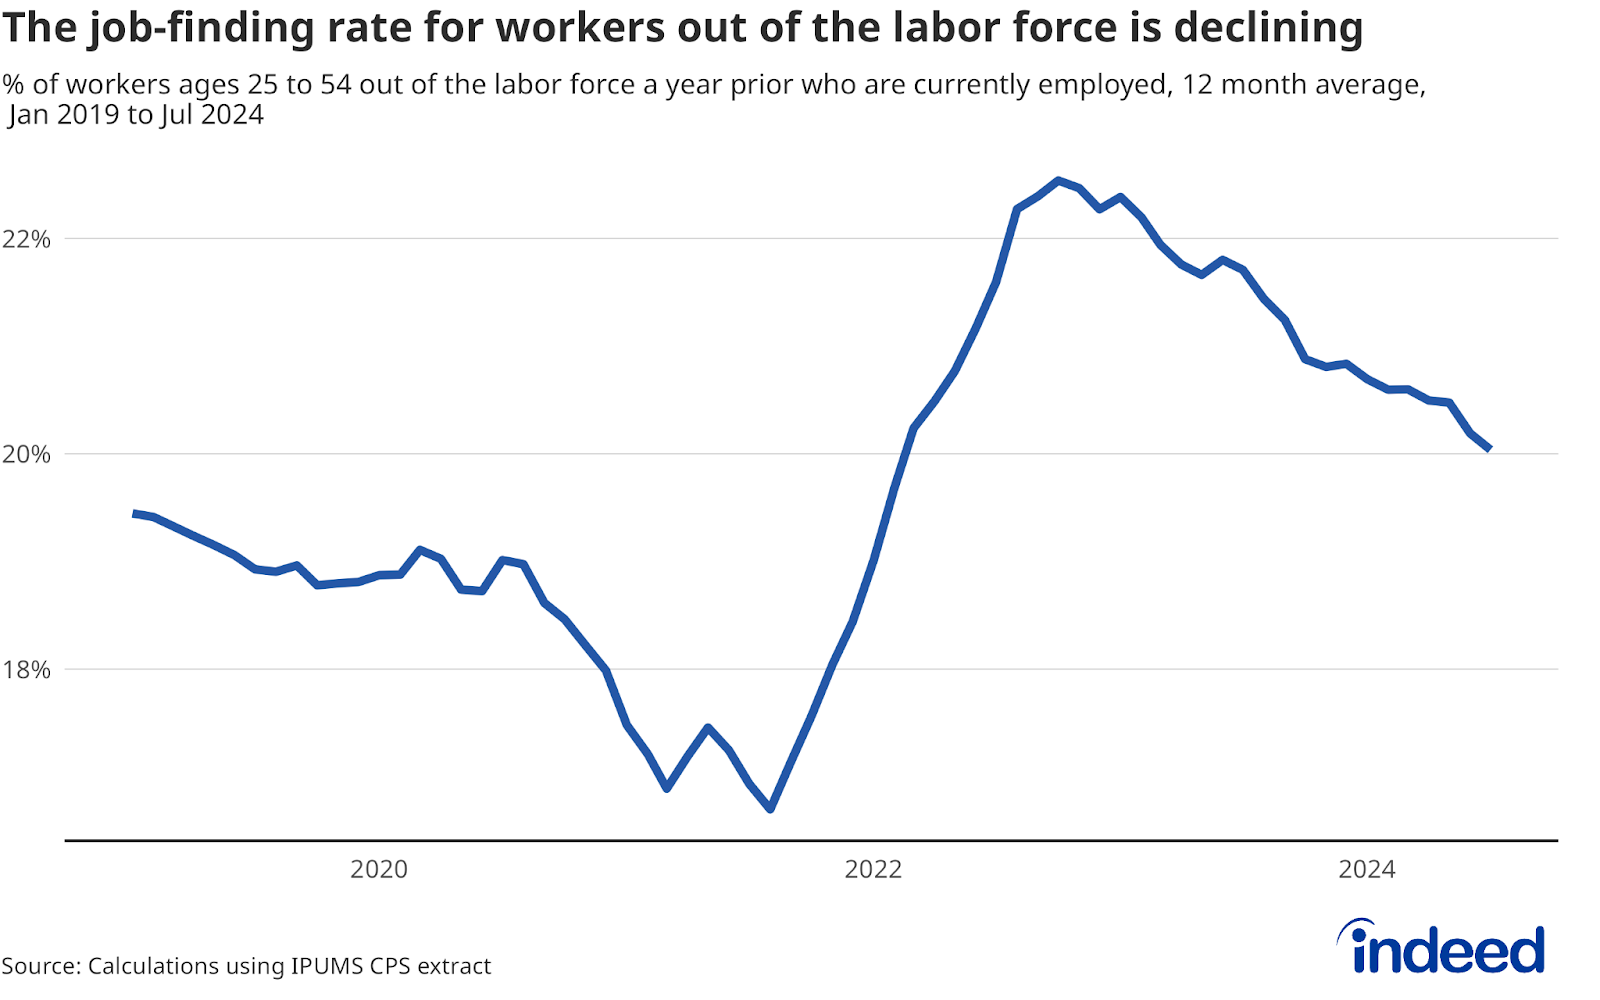
But it’s not all positive. Other data clearly show that the job-finding prospects for workers previously out of the labor force are dwindling. When the labor market is strong, many workers entering or re-entering the labor force will often skip the unemployment phase altogether and immediately find work. And while prime-age workers out of the labor force were finding work at a solid clip above pre-pandemic rates in July, the rate has fallen consistently since early 2022, and that decline seems to have accelerated this year. Within this larger picture, the pickup in not-in-the-labor-force workers moving into unemployment can be read as an indicator that workers simply can’t land a suitable job as quickly as they used to.
Taken together, these data paint a picture of a labor market that is strong enough to keep attracting workers to the labor force but not strong enough to get them a job as quickly as in the past. And while there are no signs of an immediate deterioration, the unemployment rate is likely to keep rising if more workers outside the labor force continue to jump into unemployment instead of employment. But arguably the more discouraging trend would be if we were seeing fewer workers joining the labor force at all because they did not believe they could find work. The current rise in the unemployment rate is unsettling, but the trends behind its climb certainly beat the alternatives.
Methodology
The data in this post are calculated using an IPUMS extract of the Current Population Survey (CPS) Basic Monthly microdata. The CPS data are from the household survey used to calculate the unemployment rate and other labor force statistics released every month by the Bureau of Labor Statistics.
The flow rates are calculated by looking at the rate at which individuals move from one labor force status to another. The CPS microdata allows researchers to track individuals a year apart using an anonymized identification number. This ability to match individuals 12 months apart lets a researcher see if a person has changed their labor market status. For example, consider a person who tells the CPS that they are out of the labor force in July 2023. If one year later that same person tells the CPS they are employed in July 2024, they would be considered as moving from “not in the labor force” to “employed.”
This flow of people across labor force statuses is then converted into a rate by dividing the number of people who moved from one status to another a year later by the number in the initial state in the first period. To continue our example from above, the number of people moving from out of the labor force into employment from July 2023 to July 2024 is divided by the number of people out of the labor force in July 2023.
The Indeed Wage Tracker calculates the average rate of posted wage growth by following an approach similar to the Atlanta Fed US Wage Growth Tracker, but tracks jobs, not individuals. We begin by calculating the median posted wage for a given country, month, job title, region, and salary type (hourly, monthly, or annual). Within each country, we then calculate year-on-year wage growth for each job title-region-salary type combination, generating a monthly distribution. Our monthly measure of wage growth for the country is the median of that distribution. Alternative methodologies, such as the regression-based approaches in Marinescu & Wolthoff (2020) and Haefke et al. (2013), produce similar trends.More information about the Indeed Wage Tracker data and methodology is available in a research paper by Pawel Adrjan and Reamonn Lydon, What Do Wages in Online Job Postings Tell Us about Wage Growth?