
Key Points:
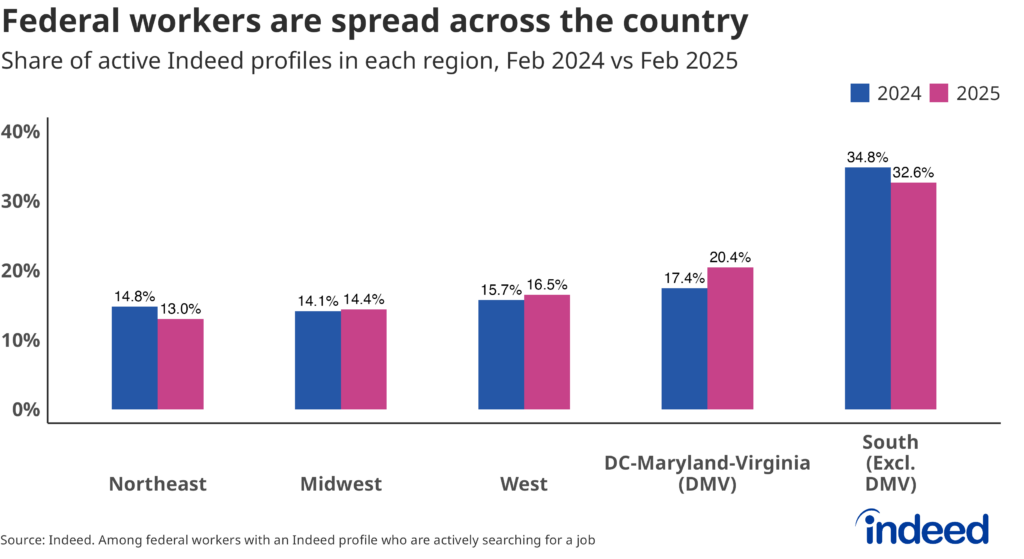
- In February, roughly 80% of active federal worker profiles on Indeed were located outside the DC/Maryland/Virginia area.
- The largest region for active searches from federal workers in February was the South (excluding DC/Maryland/Virginia), which accounted for about a third (32.6%) of all active profiles.
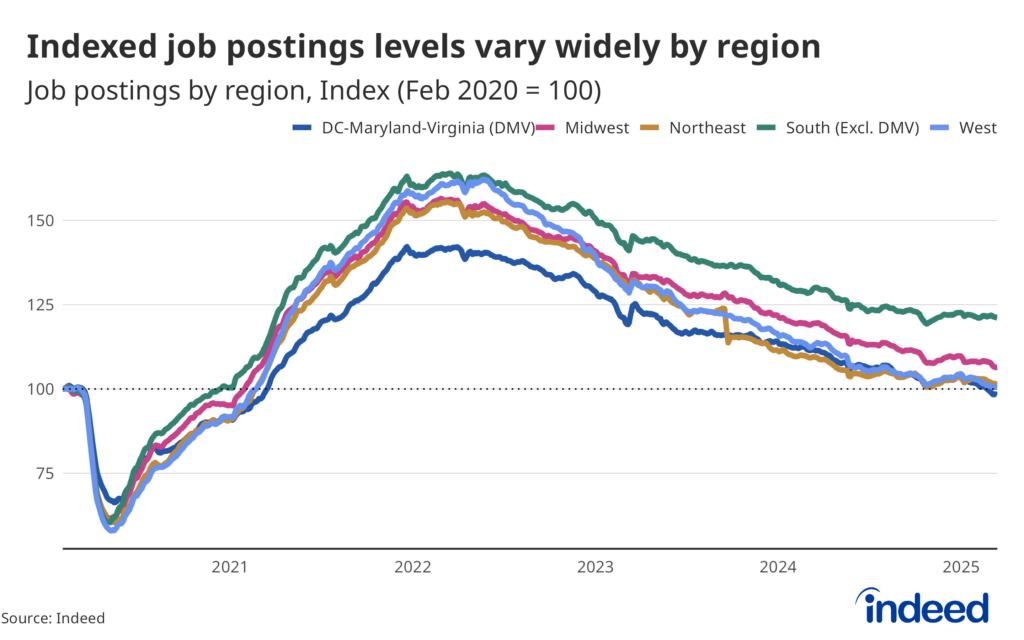
- Job postings in DC, Maryland, and Virginia were collectively 2% below pre-pandemic levels in March, but roughly 20% above pre-pandemic levels in the rest of the South.
Editor’s Note: This article is part of a series examining how US federal workers are responding to ongoing efforts to shrink the size of the federal government. Find more about federal workers’ reactions to ongoing cost-cutting efforts here and read about government employees’ demographics and skills here.
A dramatic spike in job search activity from federal employees in response to the Trump administration’s efforts to shrink the federal government is coming from all corners of the country — not just the immediate area surrounding Washington, DC. At a time when the national job market is showing signs of being frozen by uncertainty, the surge in job seekers raises questions about whether (and how) local labor markets can absorb these often highly specialized displaced workers.
According to official data, less than 20% of federal workers reside in DC, Maryland, or Virginia (collectively, the “DMV” area). The same data shows that Texas and California alone are home to a combined 12.2% of the nation’s 2.3 million federal workers. This squares with Indeed data that shows roughly 80% of active federal worker profiles on Indeed in February were located outside the DMV area, with large concentrations in states including Texas, Georgia, California, and Florida.
Federal workers all around the country are applying for new jobs
Even so, DC and its surrounding metro area have been at the center of early reporting on federal workforce reductions that are a priority of the Trump Administration and have been the focus of the newly created Department of Government Efficiency (DOGE). However, these enacted and/or proposed cuts do not appear to be disproportionately impacting employees in the DMV area. If they were, we would expect to see a surge in DMV-based federal workers looking for work that outweighed the worker population size. But the change since last year has been fairly moderate. Of those job seekers who worked for the federal government and clicked on or applied for a job in February 2025, about 20.4% were in the DC area. The largest region for active searches was the South (excluding DMV), which accounted for about a third (32.6%) of all active profiles in the same month.
Maryland and Virginia have the highest share of federal workers actively looking for work, but California, Texas, and Georgia aren’t far behind
Maryland and Virginia have a sizable share of federal workers with an active job search — a combined 18% in February 2025. Since this analysis focused on where workers live, not where they work, the city of Washington, DC, accounted for a relatively small (3%) share in the same month. Texas has the third-highest share of federal job seekers at 7%. California and Georgia followed close behind, each with 6% of the active profile pool. Alabama, Florida, Tennessee, and North Carolina contributed a combined 13% to the South’s large share of active federal worker profiles.

Geographic demand for workers
Arguably, the biggest question surrounding the early efforts to reduce federal headcount is whether the labor market can absorb these displaced workers. And while it’s still too early to tell, largely because ongoing legal challenges and reinstatements of federal workers make calculating the actual numbers and types of displaced workers difficult, Indeed data can paint a picture of where employer demand stands. We know that federal workers tend to be well-educated, with almost 70% of federal workers seeking a job holding at least a four-year degree. Data also shows that job postings in sectors with historically high formal schooling requirements have pulled back more dramatically than other roles amid a cooling US labor market. This suggests that federal workers are likely to face greater challenges in their job search now than they might have a few years ago.
In addition to a broad, nationwide decline in knowledge work roles, actively searching federal workers are also likely to face challenges related to diverging local labor markets. Indeed data shows that job postings in regional labor markets followed similar declining patterns during the pandemic, but their recoveries have varied. Despite experiencing one of the largest drops in job postings during the pandemic (a drop of 40% from February to May 2020), job posting volumes in southern states (excluding the DMV area) recovered quickly and have hovered around 20% above pre-pandemic levels for several months now. In contrast, job postings in the DMV area were slower to rebound and have been hit harder since 2022 by a cooling regional labor market. As of March 2025, job postings in DC, Maryland, and Virginia measured 2% below pre-pandemic levels, representing fewer overall job opportunities now versus February 2020.
Much of the growing divide in regional labor markets stems from the mix of jobs available in each area. Nationally and regionally, some occupational sectors have experienced more dramatic declines in job postings than others, including tech roles like software development and information design & documentation. In general, in-person and/or healthcare roles have remained in high demand, while knowledge-work and remote-friendly sectors have pulled back most. As a result, regions that employ a greater share of those remote-friendly and/or knowledge work jobs have taken a bigger hit in recent years.
For instance, in February 2022, around the time job postings peaked nationwide, software development accounted for 6.5% of DMV job postings, compared to 3.2% of postings in the South. By February 2025, those shares had fallen to 4.3% and 1.4%, respectively. In other words, a rapid cooling among white-collar roles has led to stronger representation from in-person and healthcare jobs among available roles. As a result, a displaced nurse from the Department of Veteran Affairs (VA) looking for work will face a very different job market than a displaced IT Management worker from the Department of Defense.
The labor market is still pretty solid, but this expansion continues to be driven by a few industries, including healthcare and social assistance. Even if there are theoretically enough open jobs out there, a worker might not be able to, or want to, go from losing their job in the Department of Education to being a nurse. Additionally, they may not be in a position to quickly relocate to a different region where the job opportunities more closely match their experience or education. Ultimately, federal workers’ prospects of finding new employment may depend largely on the type of work they do (or are seeking) and/or their ability to relocate.
Methodology
On data privacy: To protect workers’ personal information, all datasets are stripped of identifying information, including names and addresses. Results are only reported in an aggregated format. Analysis and data review are also performed to ensure that data points cannot be tied back to individuals.
For this analysis, we utilized Indeed’s pool of hundreds of millions of job seeker profiles to identify active job seekers who listed the federal government as their current or (newly) former employer. We then grouped them by their highest listed education level, skills, job titles, and current/former department or agency. United States Postal Service workers were excluded to allow for comparisons with Office of Personnel Management and Bureau of Labor Statistics data.
Application data is based on the number of workers who started an application on Indeed, regardless of whether they saw the process through. Search data is based on phrases used by job seekers with an Indeed profile only. Time series data are seasonally adjusted to provide a clearer look at the trends. US searches on Indeed included queries on both the desktop and mobile versions of Indeed.
Data on seasonally adjusted Indeed job postings are an index of the number of job postings on a given day, using a seven-day trailing average. February 1, 2020, is our pre-pandemic baseline, so the index is set to 100 on that day. Data for several dates in 2021 and 2022 are missing and were interpolated.
The number of job postings on Indeed.com, whether related to paid or unpaid job solicitations, is not indicative of potential revenue or earnings of Indeed, which comprises a significant percentage of the HR Technology segment of its parent company, Recruit Holdings Co., Ltd. Job posting numbers are provided for information purposes only and should not be viewed as an indicator of performance of Indeed or Recruit. Please refer to the Recruit Holdings investor relations website and regulatory filings in Japan for more detailed information on revenue generation by Recruit’s HR Technology segment.