Key points:
- In Q1 2026, compensation costs for private industry workers increased 3.4% year-over-year, in line with the year-on-year increase observed in Q4 2025, according to the Bureau of Labor Statistics.
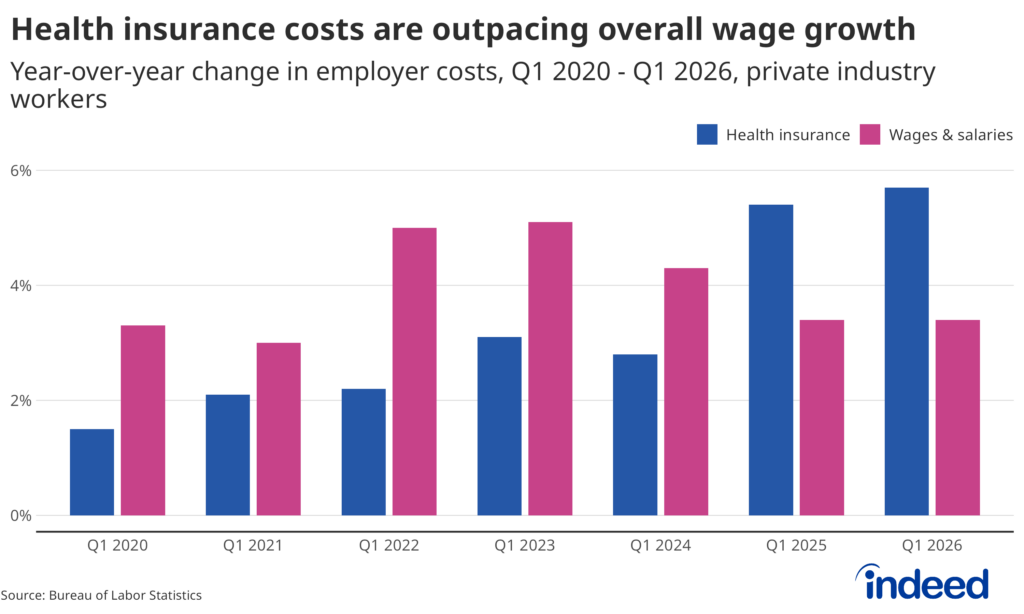
- Health insurance costs to employers increased by 5.7% year-over-year, continuing the trend of costs growing faster than wages for the fifth consecutive quarter.
- Real wage growth remained thin, with an annual increase of 0.1% for civilian and private industry workers.
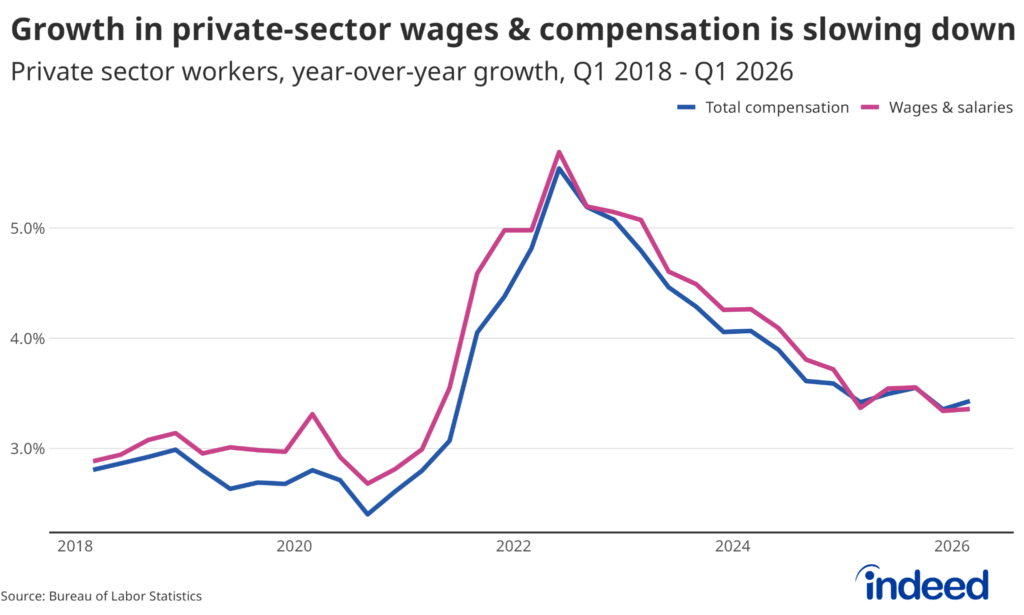
At the start of 2026, the fastest-growing line item in employers’ compensation budgets wasn’t wages — it was insurance costs. Compensation costs for private industry workers increased by 3.4% year-over-year, according to the Bureau of Labor Statistics’ Employment Cost Index (ECI). Although wages and salaries are still increasing, a meager 0.1% gain in constant dollars (inflation-adjusted) indicates that workers experienced little improvement in purchasing power over the past year. The data also shows that for much of the past year, health insurers have generally been getting bigger raises than workers. And that trend may only accelerate going forward.
Annual growth in wages and salaries accelerated slightly in Q1, up from the 3.3% rate seen last quarter. Year-on-year growth in wages and salaries for non-incentive paid workers fell from 3.4% in Q4 2025 to 3.2% in Q1 2026, suggesting that the slight growth in headline numbers was largely due to volatile pay for a portion of workers. The growth in wages and salaries continued the downward trend observed since year-over-year growth for private industry workers peaked at 5.7% in Q2 2022 (non-seasonally adjusted).
For most of the post-pandemic period, the biggest driver of rising employer compensation costs was wages; higher employer costs were reflected in larger worker paychecks. But since Q1 2025, employers’ health insurance costs have quietly been growing faster than the wages they pay. In Q1 2026, health insurance costs for employers grew by 5.7% year-on-year, compared to just 3.4% for wages.
Several forces are converging on employer health costs at once. First, group insurance premiums are climbing, up around 6% per employee since last year in 2025, an almost 20-year high. And further pressures are building on top of that. At the end of 2025, Affordable Care Act (ACA) subsidies that helped keep public marketplace health insurance premiums affordable for millions of Americans expired. For the program’s roughly 22 million enrollees, average annual premiums are estimated to more than double in 2026. And the effects are likely to reach well beyond the marketplace.
Workers who can no longer afford marketplace coverage will increasingly seek employer-sponsored plans, likely making health benefits a more decisive factor in where people choose to work. At the same time, rising premiums will push healthier individuals out of the public marketplace, so insurers may raise premiums across the board, a cost that will also likely spill over into employer-sponsored plans as well.
For employers, rising health insurance costs are particularly difficult to manage because they compound quietly, showing up in the total compensation without appearing in the worker’s paycheck. It’s worth keeping an eye on this metric going forward. Employer insurance contracts often renew annually, so the ripple effects of the subsidy expiration may not be immediately reflected in the data. A further acceleration in employer health costs could still be on the way.
What is the ECI?
The quarterly Employment Cost Index (ECI) measures changes in employers’ hourly labor costs over time. It captures total compensation by combining wages and salaries with employer-paid benefits, including health insurance and retirement contributions, to show the full cost of employing workers.
The ECI reports labor costs as an index, with each value benchmarked to a fixed base period (currently December 2005) set to 100. So, an index of 110 means labor costs have risen 10% since December 2005. What is important is how the index changes over time. Quarterly and year-over-year percent changes show whether labor cost pressures are accelerating or slowing, offering insight into compensation trends.
Additionally, it’s important to account for inflation to put changes in context. Constant (real) dollar estimates adjust nominal compensation for shifts in consumer prices to track real changes in what the wage is worth. Looking at both nominal and real measures helps distinguish between headline changes in pay and whether compensation is truly rising or falling in real terms.
Why is the ECI unique?
The ECI holds the employment distribution across industries, occupations, and ownership types constant, effectively controlling for any shifts in workforce composition. Without this adjustment, growth in higher-paying industries or declines in lower-wage roles can make labor costs appear to rise or fall even if the underlying pay hasn’t changed.
The result is a reliable signal on the price of labor, providing a clear measure of the actual change in the cost of employing a given workforce from one period to the next.