
Key points:
- Moderate job gains were once again swamped by elevated population growth in Q2 2024, causing the unemployment rate to drift up to its 2017 level. Youth unemployment has been particularly sensitive, partly because the age 15-24 population has soared.
- Weaker conditions were driven by slow hiring, rather than higher layoffs, resulting in a growing dichotomy between those with and without stable employment.
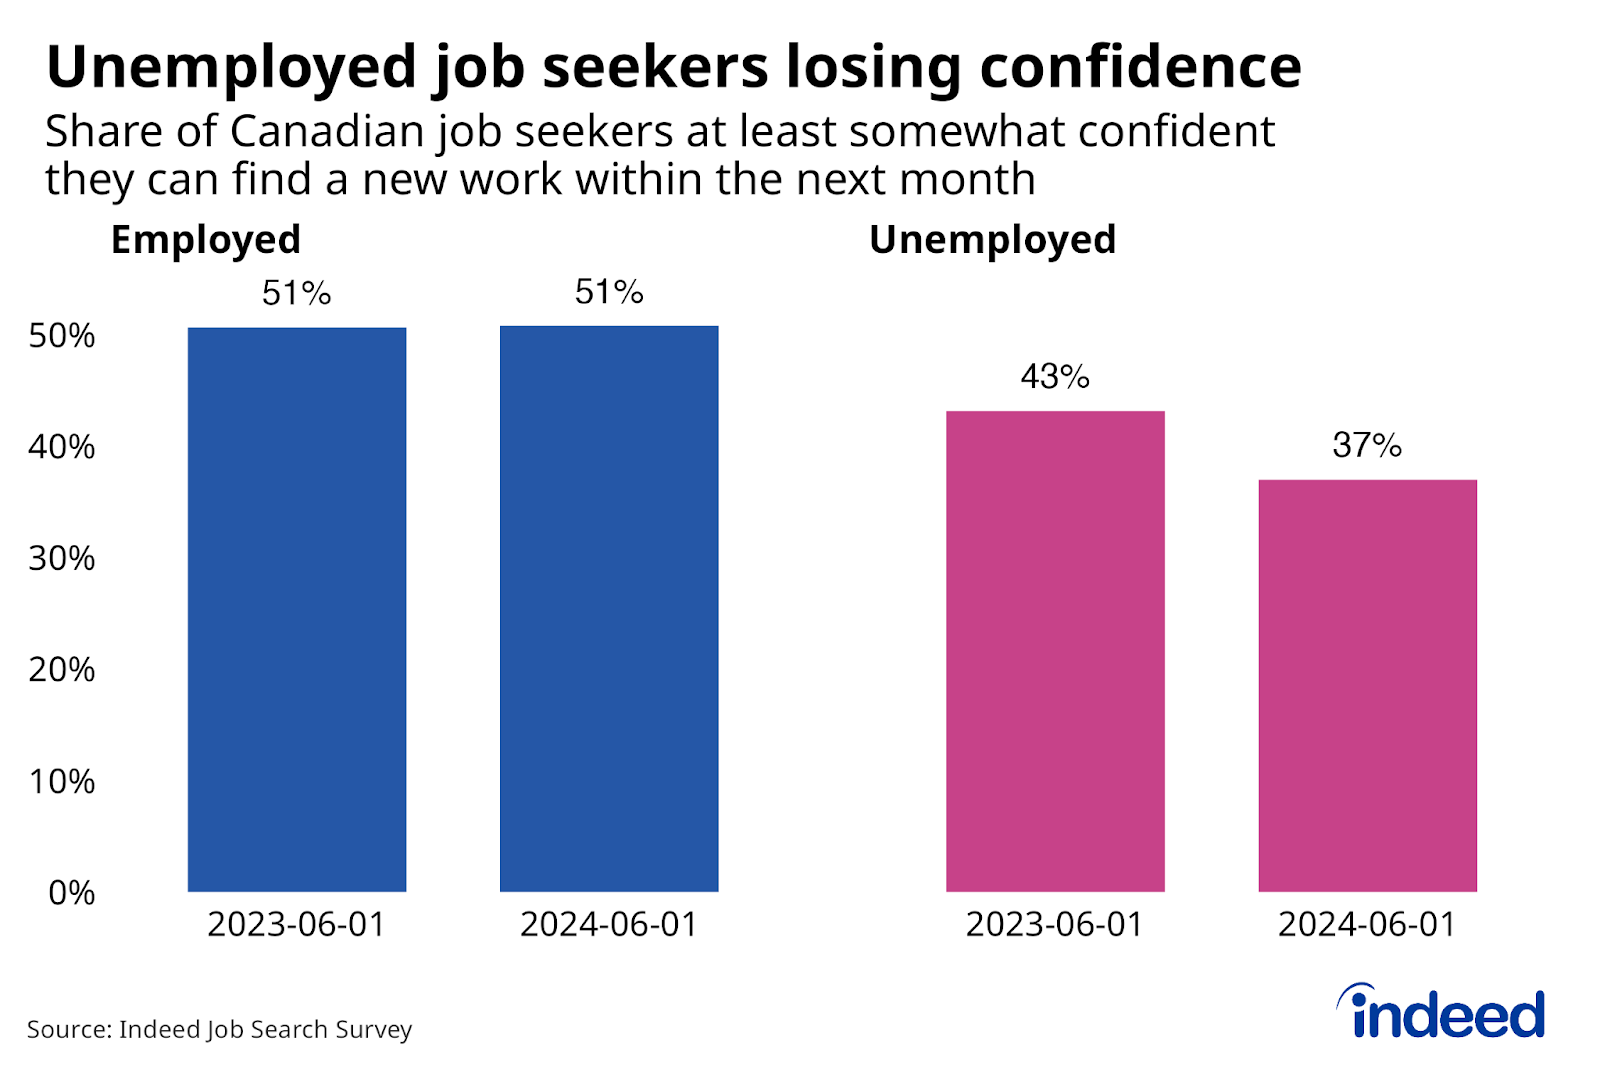
- This environment has hit the confidence of unemployed job seekers: According to the June Indeed Job Search Survey, only 37% of those who were out of work and actively looking were at least somewhat confident they could find a job within the next month, down from 43% a year earlier, and well below the stable 51% share among employed job seekers.
- Job postings dipped below their pre-pandemic level in June, and were down 4% from February 2020 levels by late July. Trends have been similar across the vast majority of occupations, demand only remaining particularly elevated in a few sectors, such as health care.
- Despite looser conditions, wage growth has remained robust, while the Indeed wage tracker which tracks wages advertised in job postings was still growing 3.4% year-over-year in Q2.
The Canadian labour market situation deteriorated somewhat in the second quarter of 2024. Slow hiring and declining job vacancies made it tougher to find work, amid ongoing rapid population growth, particularly among youth. At the same time, conditions have remained sanguine among those already comfortably employed, as layoffs stayed low, and wage growth held solid.
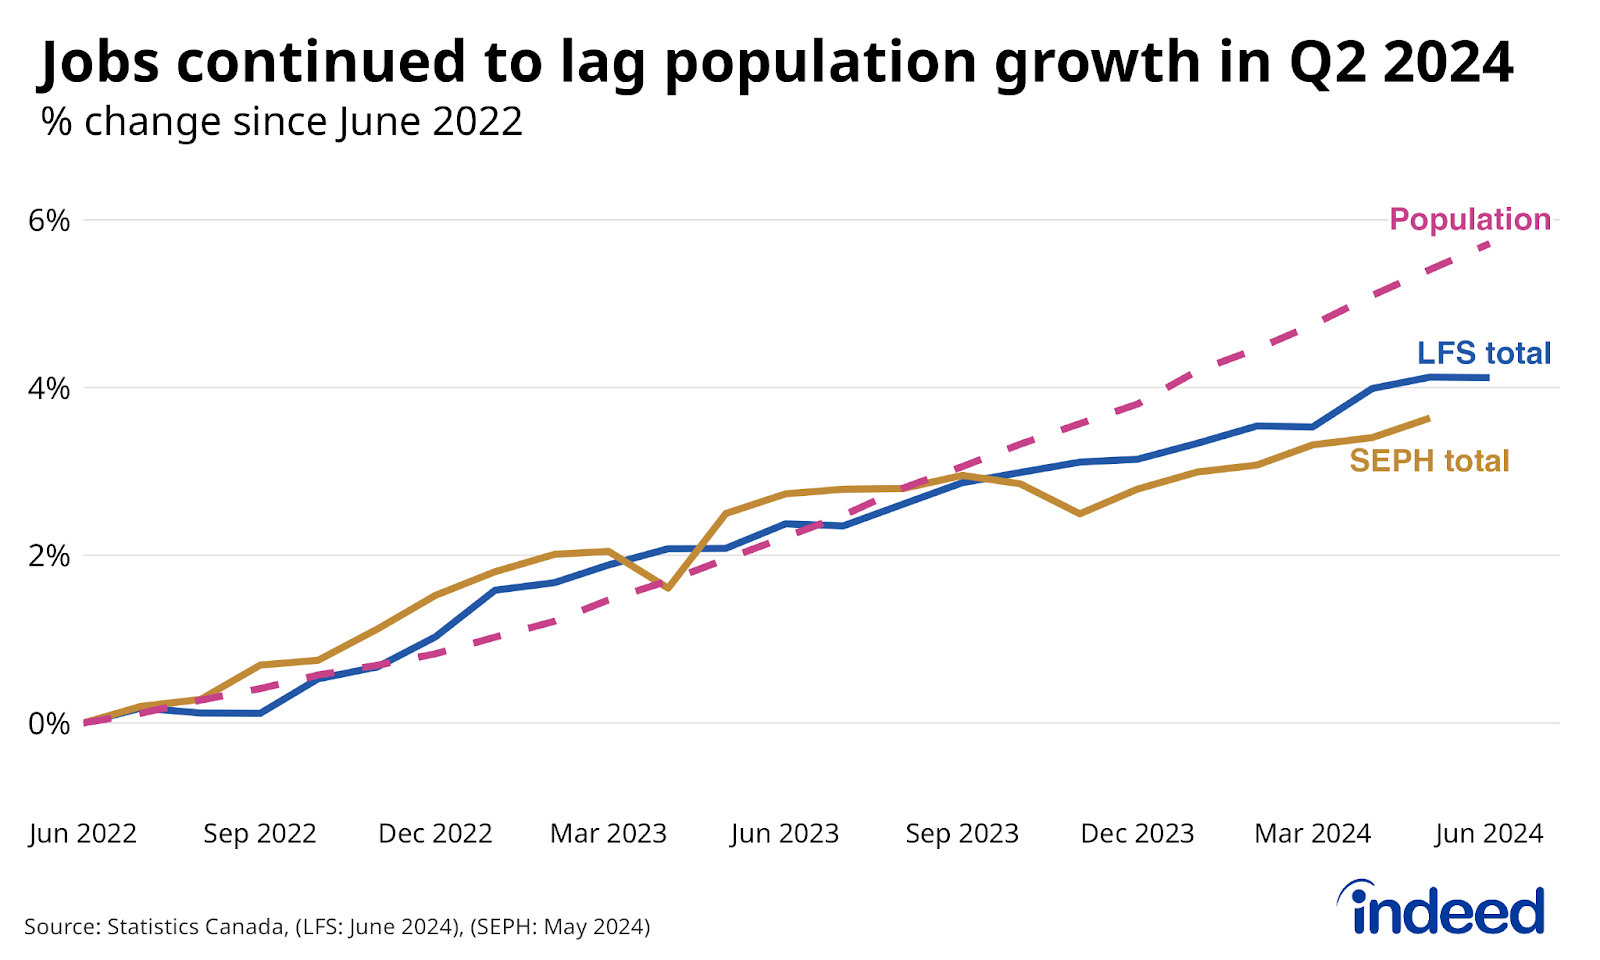
Job growth was choppy in Q2 2024, with a strong April Labour Force Survey (LFS) followed by a relatively flat May and June. Meanwhile, the broader trend held consistent: For the fifth straight quarter, employment failed to keep pace with population growth, and the Canadian labour market continued its gradual weakening.
Not many industries have posted strong gains lately. According to the Survey of Employment, Payrolls, and Hours (SEPH) — which is less volatile at the industry level than the LFS — healthcare and social assistance, together with education, accounted for more than half of net job growth over the three- and six-month periods through May 2024. Job growth in most other industries has been lukewarm, and a few sectors (including retail trade), have declined since the end of 2023.
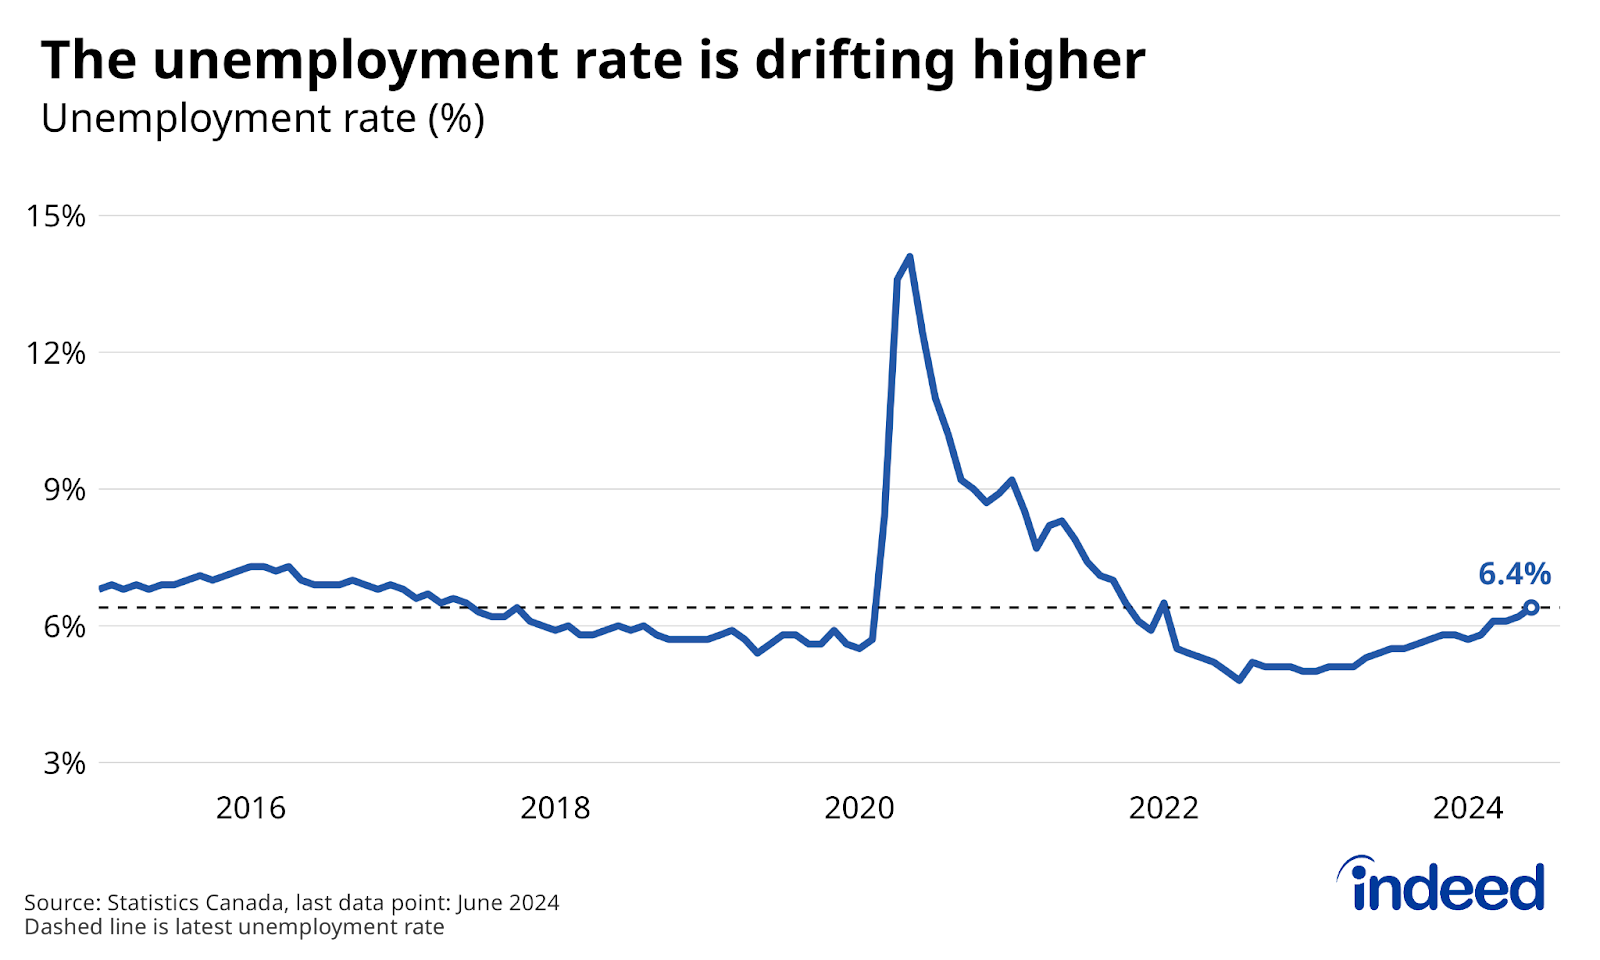
These softer conditions have translated into a rising unemployment rate, which increased 0.3 percentage points between March and June to 6.4%, the highest jobless rate (outside of the pandemic) since late 2017. Underemployment — the share of all workers employed in part-time jobs who’d prefer full-time — was also up 0.4 percentage points over the past year, from 3.1% to 3.5%. Unlike the unemployment rate, underemployment remains below its 2019 levels.
Weak hiring continues to drive these negative trends. The new job rate in Q2 averaged 1.8%, 26% below its 2017-2019 average of 2.4%, continuing a trend seen throughout 2023. This partly reflects fewer people switching jobs, but is also an indication that those currently out of work are having a harder time finding new opportunities.
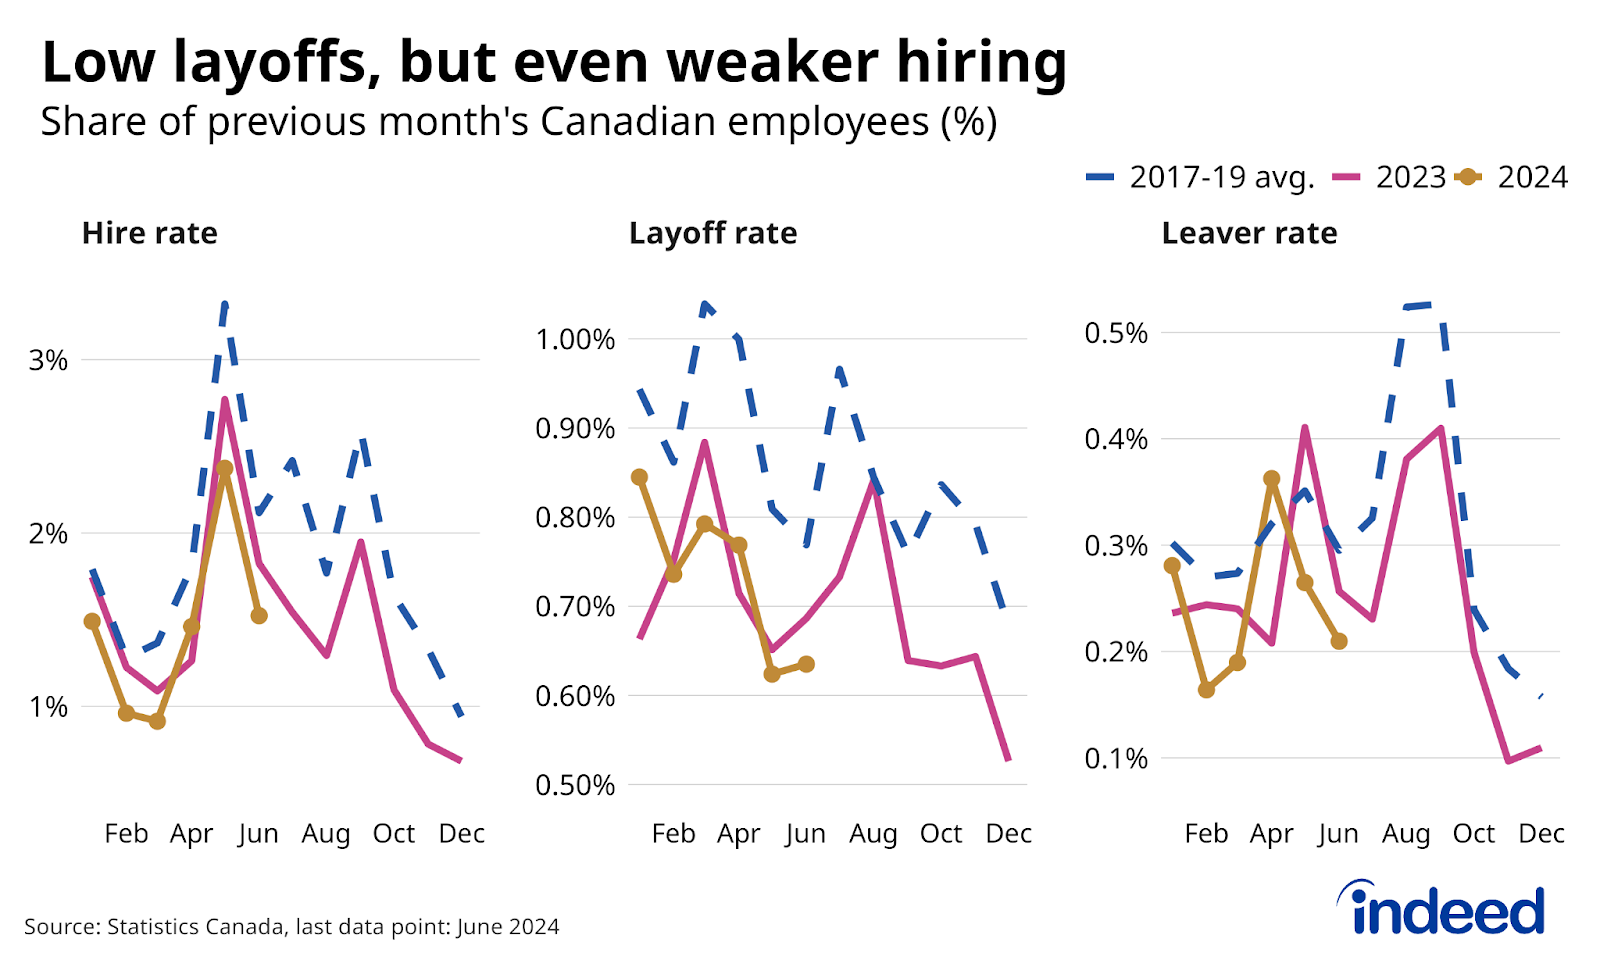
At the same time, while employers aren’t adding many new workers, the economy has held steady enough that they aren’t letting go of existing staff at elevated levels either. The layoff and discharge rate in Q2 stood at 0.68%, 21% below its 0.86% pre-pandemic level. The slow pace of job losses has likely been a key reason why the rise in unemployment has been more gradual than in past recessions.
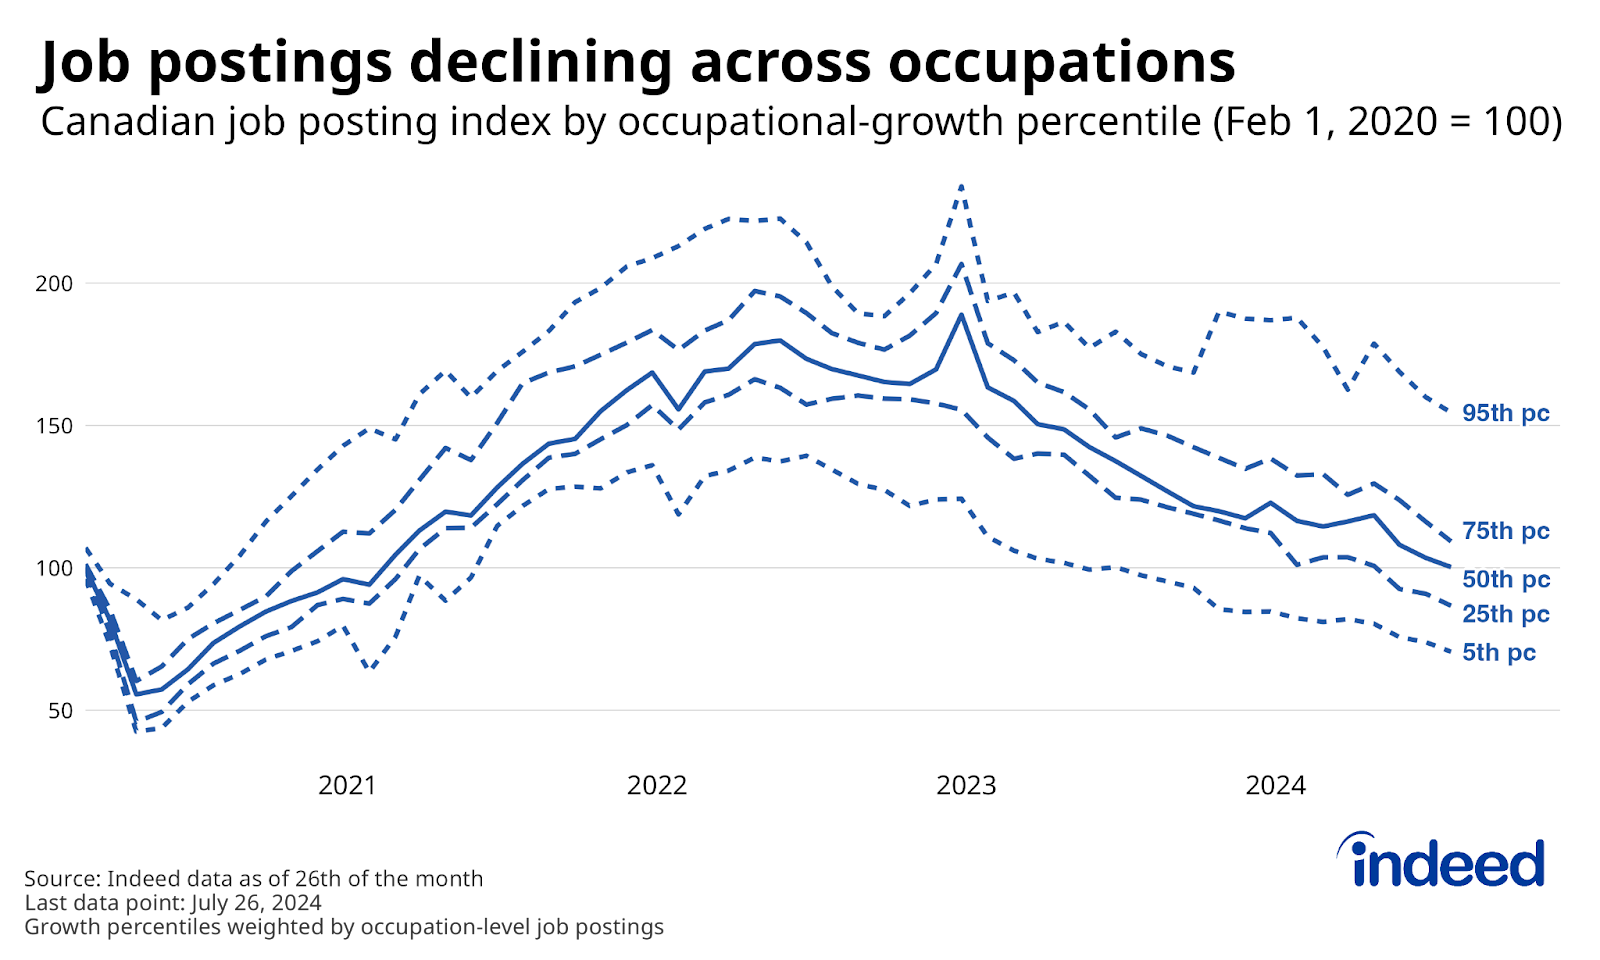
Job postings resume downward trend, slipping below baseline in June
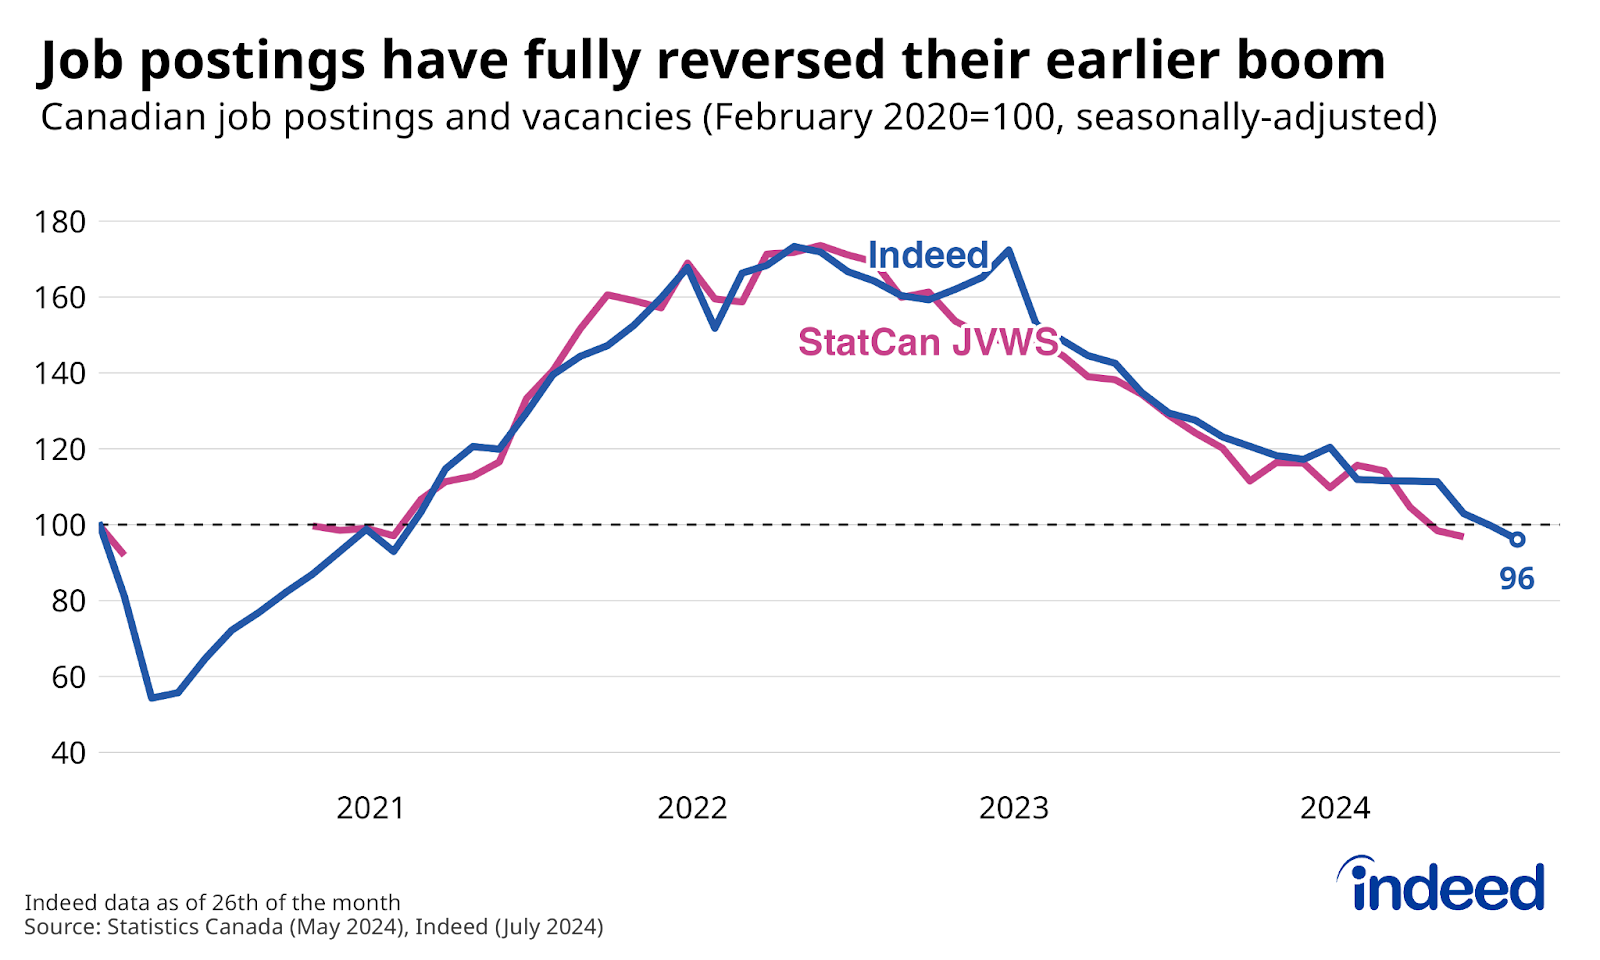
Both job vacancies reported by Statistics Canada and job postings on Indeed are down sharply from their peaks since mid-2022. Postings stabilized briefly in Q1, but started falling again in May, and recently slipped below their pre-pandemic baseline for the first time since they began rising dramatically in early 2021. As of late July, Canadian job postings were 4% below their February 2020 level.
The downshift in hiring appetite has been broad-based. Job postings in half of occupational sectors tracked were either at or below their pre-pandemic level. And some are down significantly, including the software development sector, where postings in late July were 32% below pre-pandemic levels. Other categories have held up better, but the trend is pointing in the same direction. Only a few occupations, mainly in health care, such as nursing, have postings that still substantially exceed their pre-pandemic levels, and have held relatively steady amid a cooldown across most of the economy.
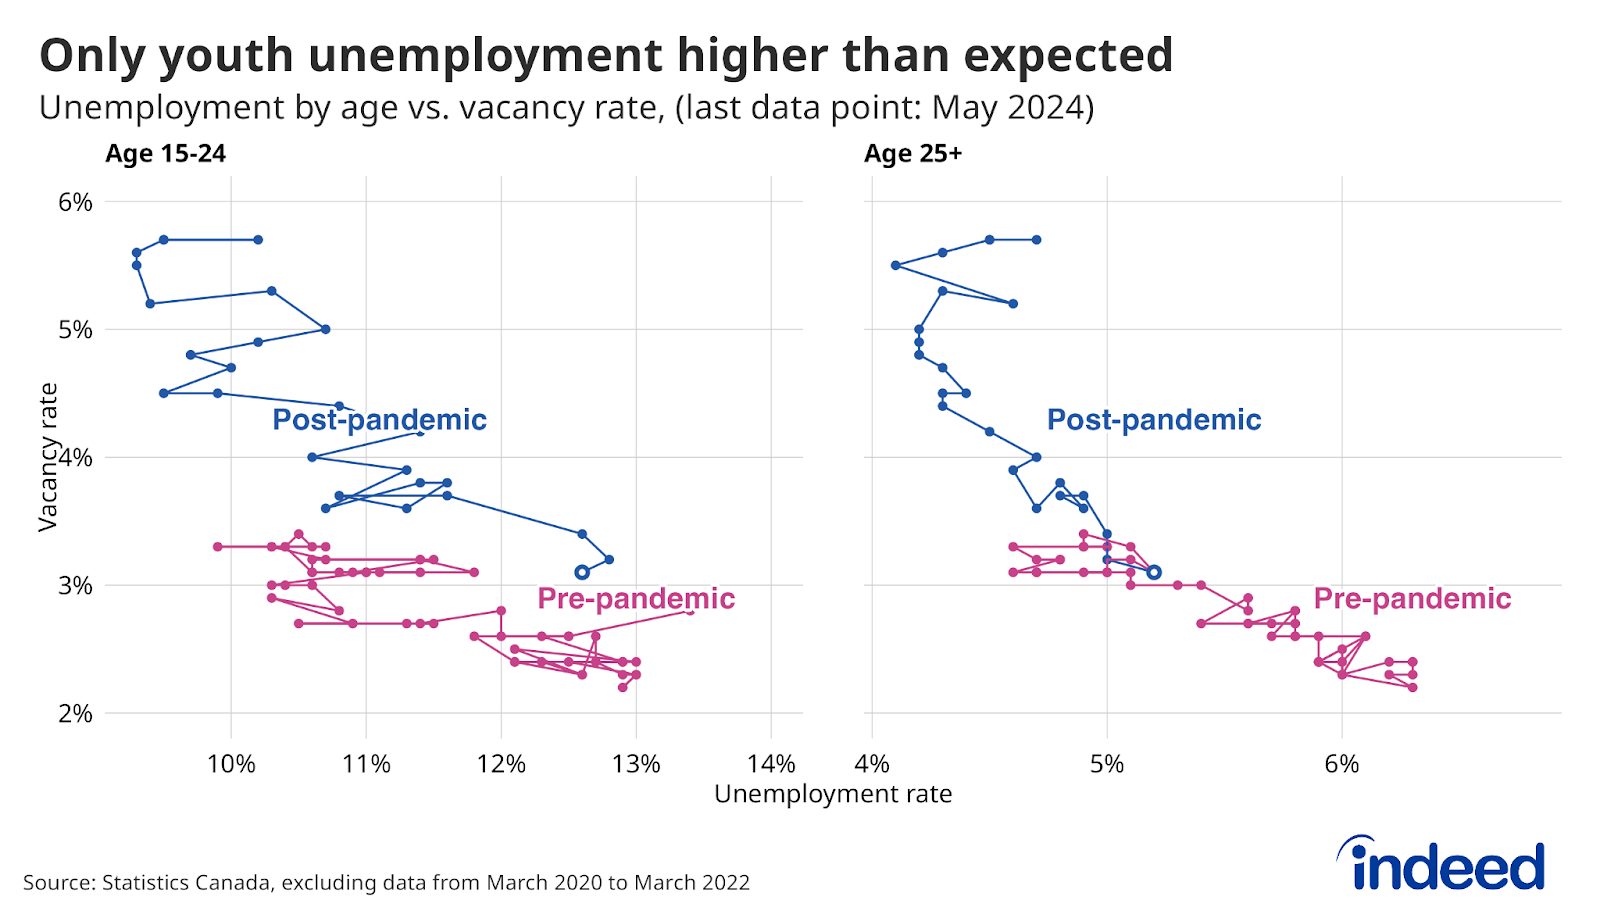
Both demand and supply factors pushing up youth unemployment
The drop-off in employer demand from its earlier heights is one factor pushing up unemployment. But among some groups, especially younger Canadians, the jobless rate is higher than we’d expect from falling vacancies alone. In May 2024, the job vacancy rate stood at 3.1%. At times during 2018 and 2019 when the rate was also at that level, the unemployment rate among 15-to-24-year-olds ranged between 10.6% and 11.8%. This May, the youth unemployment rate stood notably higher, at 12.6%. In contrast, among those 25 and older, the prevailing 5.2% unemployment rate was within its previous range.
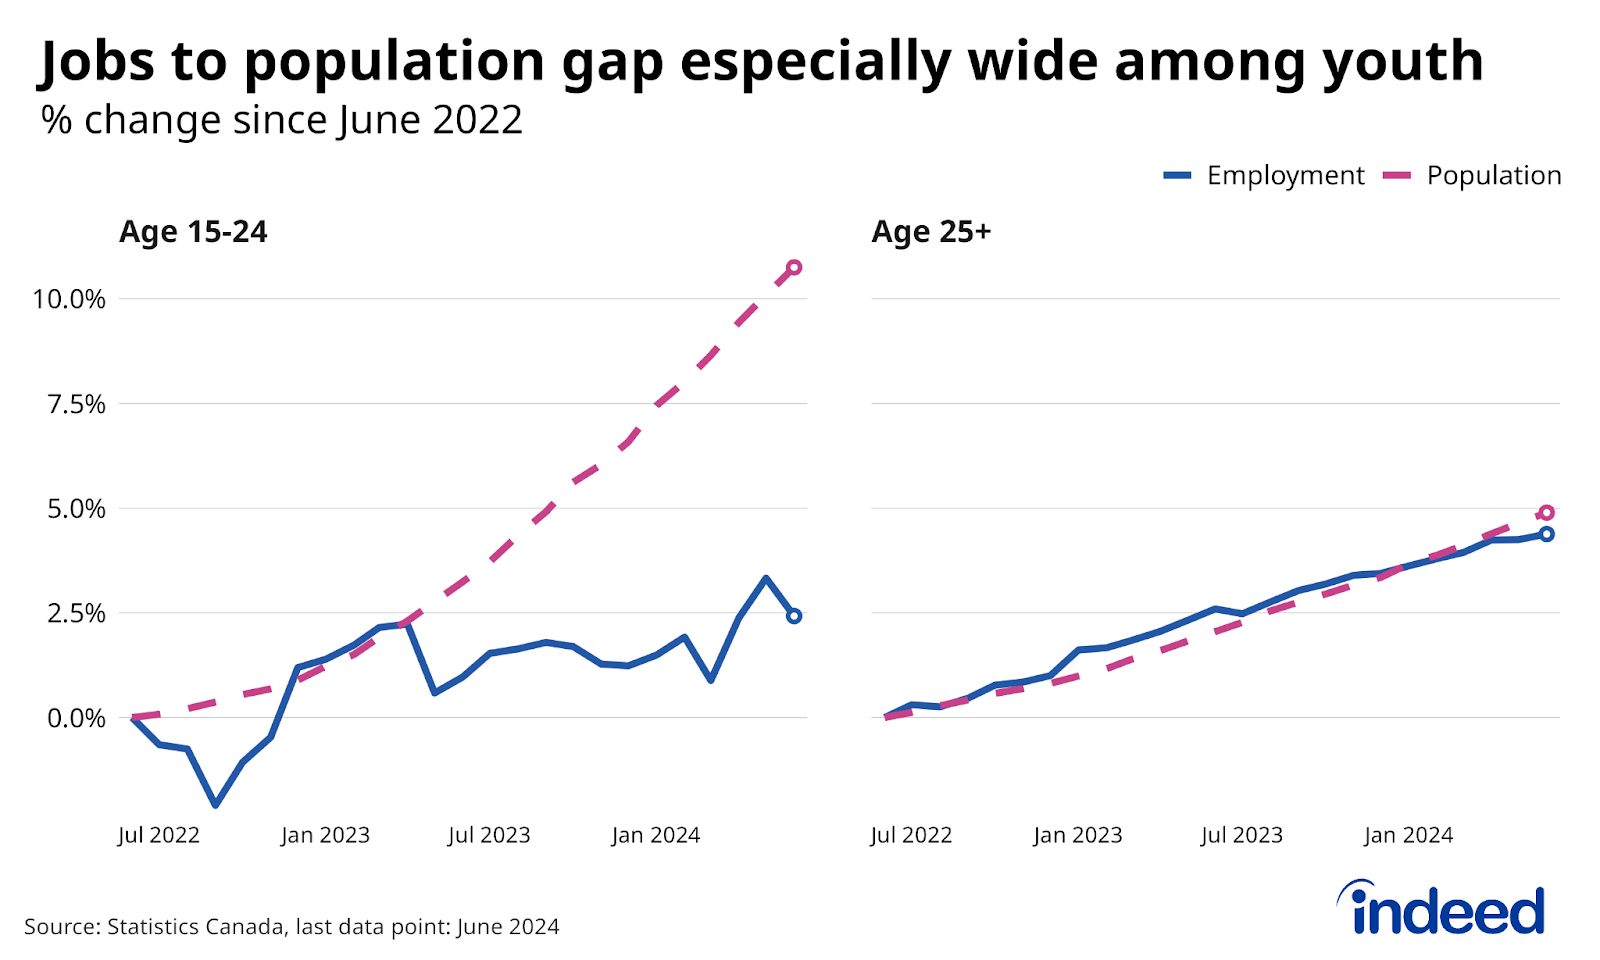
Soaring youth population growth is a likely driver of the cohort’s outsized jump in unemployment. The number of 15-24-year-olds in Canada jumped 7.3% year-over-year in June, according to the LFS, far outpacing the (still elevated) 2.8% growth among those over age 25. Amid falling demand, the surge in newcomers wasn’t accompanied by more people working, including in many of the industries that typically employ non-permanent residents. Instead, youth unemployment is up across the board, among recent arrivals, longer-tenured immigrants and those born in Canada.
Wage growth holding solid
Both the weaker labour market and slower inflation have been foreshadowing weaker wage growth from its solid recent pace. But hourly pay continued to grow briskly through June. Wage growth in the LFS (adjusted for jobs mix) actually accelerated in June, to 4.5% year-over-year growth from 3.3% in March, even as the unemployment rate rose. Growth was even stronger among youth, despite their lagging job numbers.
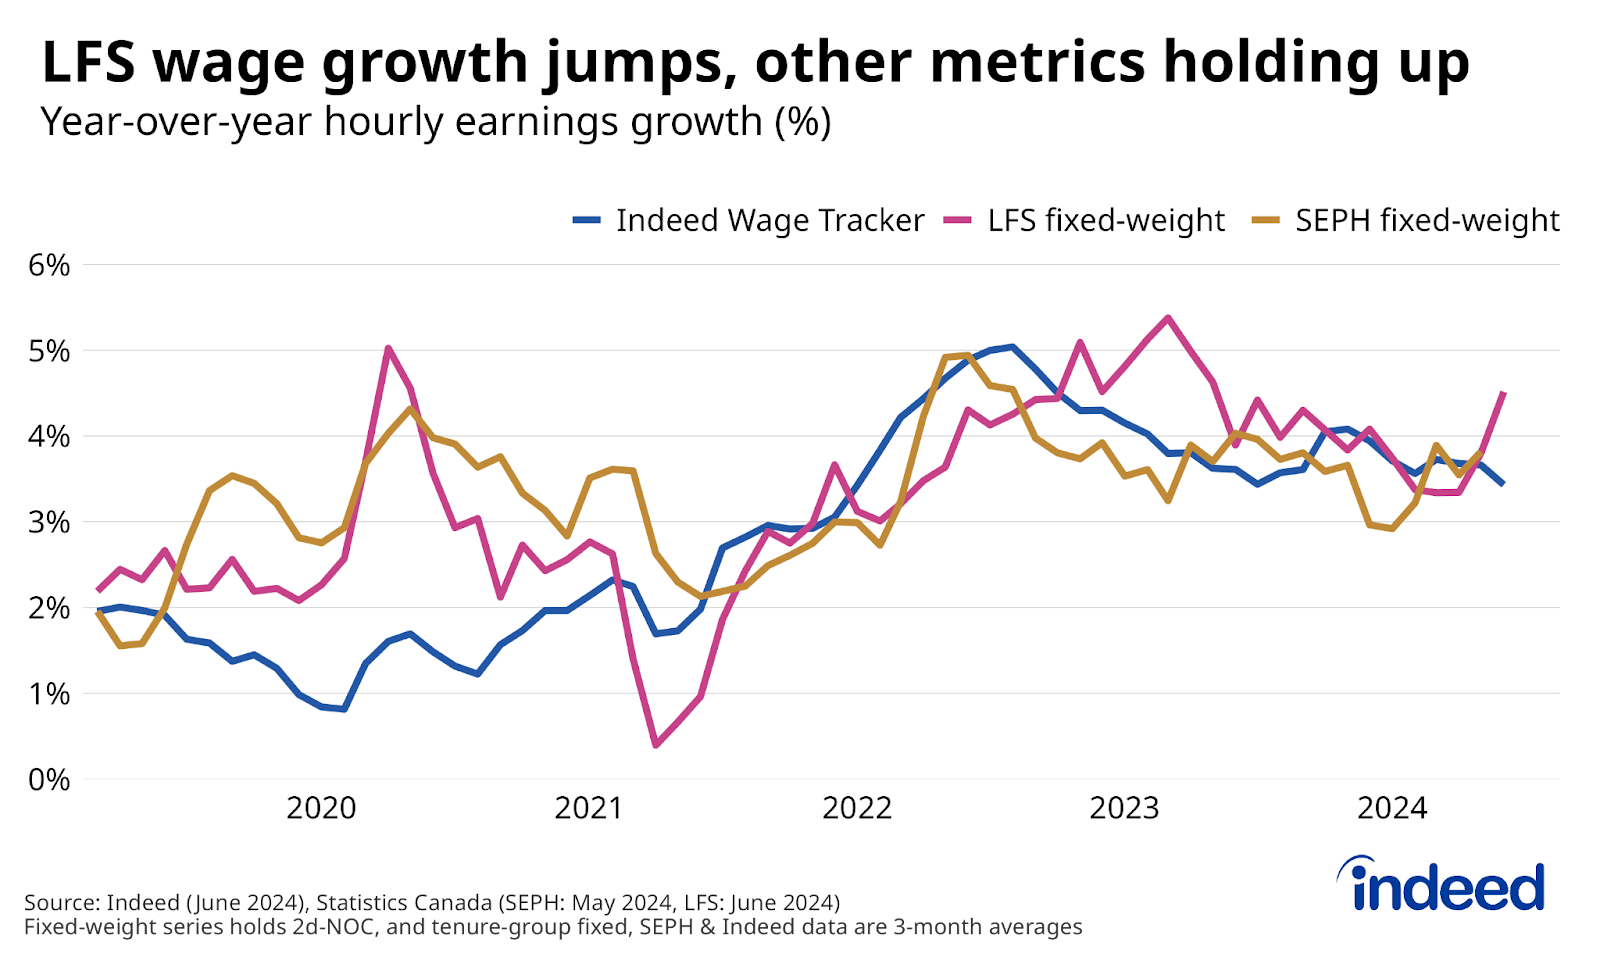
Wage growth hasn’t been as strong in other metrics, but remains in decent shape. Hourly pay rose at a still healthy average of 3.8% year-over-year over the three months through May, according to SEPH. Meanwhile, advertised wages and salaries in Indeed job postings were up 3.4% year-over-year in Q2. In both cases, the rate of wage growth was similar to where it stood a year earlier, despite the changing economic backdrop.
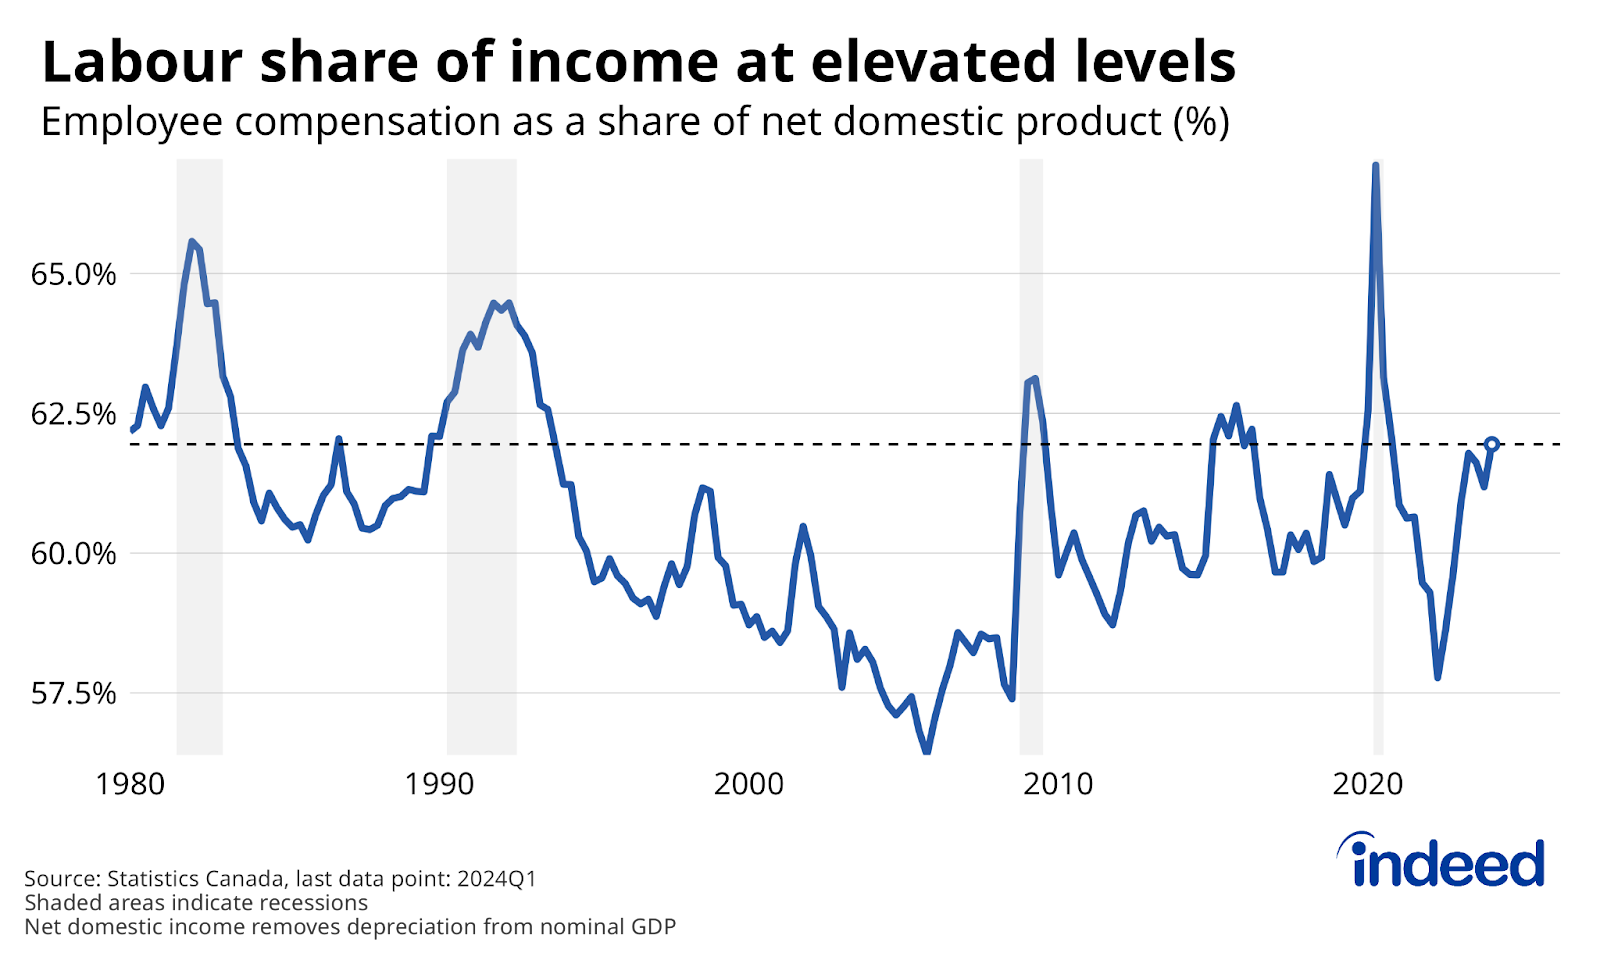
Since mid-2022, there’ve been questions about the room for stronger wage growth to catch up to earlier inflation, given the potential feedback from higher labour costs to prices themselves. For the most part, the situation has turned out well: Inflation has cooled and robust wage growth has outpaced price increases, despite falling labour productivity. Instead, pay gains have primarily shown up in a jump in the labour share of income, which in Q1 hit levels rarely seen outside of recessions.
Looking ahead, further increases in real wages without productivity growth will be tough to come by, at least without other negative side effects. For instance, the fact that youth wage growth has remained strong could be one reason employers haven’t hired more young workers despite their surging ranks. At the same time, greater labour market slack could start translating to slower pay gains, which employers expect, according to the Bank of Canada’s Q2 Business Outlook Survey.
Job seekers’ pessimistic outlook
On the whole, the Canadian labour market remained in a rut in the second quarter, but the situation is also diverging between those in stable employment and those out of work or in precarious situations. This dichotomy is also evident in data from the Indeed Job Search Survey: While job seekers who are already employed tend to be more confident than those who are unemployed, the gap has widened recently. In June 2024, 51% of employed job seekers said they were at least somewhat confident they could find a job in the next month, unchanged from a year earlier. Meanwhile, the share of unemployed who said they were similarly confident dropped from 43% to 37%.
The labour market is unlikely to shake off its cobwebs absent an improvement in the broader macroeconomic environment. A potential positive sign would be if job postings finally start reversing their steady decline. But until broader economic growth improves, a cloud will be hanging over the labour market, with the question lingering whether the gradual weakening will continue, or accelerate into something more dire.
Methodology
All job postings figures in this blog post are the index of seasonally-adjusted Canadian job postings on Indeed re-based to February 1, 2020, using a seven-day trailing average. February 1, 2020, is our pre-pandemic baseline. We seasonally adjust each series based on historical patterns in 2017, 2018, and 2019. Each series, including the national trend, occupational sectors, and sub-national geographies, is seasonally adjusted separately. This week, we applied our quarterly revision, which updates seasonal factors and fixes data anomalies. Historical numbers have been revised and may differ from originally reported values. New job postings are posts that are seven days old or less.
The number of job postings on Indeed, whether related to paid or unpaid job solicitations, is not indicative of potential revenue or earnings of Indeed, which comprises a significant percentage of the HR Technology segment of its parent company, Recruit Holdings Co., Ltd. Job posting numbers are provided for information purposes only and should not be viewed as an indicator of performance of Indeed or Recruit. Please refer to the Recruit Holdings investor relations website and regulatory filings in Japan for more detailed information on revenue generation by Recruit’s HR Technology segment.
To calculate fixed-weight wage growth in the LFS, we bucket LFS microdata for each of the 43 occupation groups into three levels of job tenure (6 months or less, 7 to 24 months, and 25 months and over), and recalculate headline average wages into a composition-adjusted measure by holding their respective weights constant at February 2020 levels. For more information on how we assessed the exposure of different occupations to generative artificial intelligence, please refer to the methodology note.
Data on rates of layoffs, job leavers, and hires, as well as LFS fixed-weight wages, were calculated using the LFS public use microfiles.
The Indeed Job Search Survey is an online survey of 10,000 Canadian adults ages 18-64, which was conducted in June 2023 and June 2024. Weights were applied to match respondent distributions across age, educational attainment, and time spent in Canada with the Labour Force Survey public-use microfile data from January 2021 through June 2021.