At last, a meaningfully positive surprise from the Canadian job numbers to end 2024. For the first time in nearly two years, the number of people working rose by more than the size of the population (91,000 vs. 67,000). Hours worked also posted solid gains after flatlining for much of the second half of the year. Meanwhile, the unemployment rate partially reversed its November pop, coming in at 6.7%. 

Line-bar graph titled “Job growth exceeded population growth in December” shows the monthly change in Canadian employment and population from August 2022 through December 2024, according to the Labour Force Survey. Employment jumped in December, meaningfully above population growth for the first time in 2024.

The jobless rate provides a useful gauge of where the labour market stands: The situation isn’t great, as unemployment is still up nearly a full percentage point from late 2023 to 6.7%, where it stood in 2017. But solid months like December have also helped the situation from falling off the rails. 

Line graph titled “The unemployment rate rose to 2017 levels in 2024” shows the Canadian unemployment rate between January 2015 and December 2024. The unemployment rate was up 0.9 percentage points over the twelve months through December, standing at 6.7%, where it was in 2017.

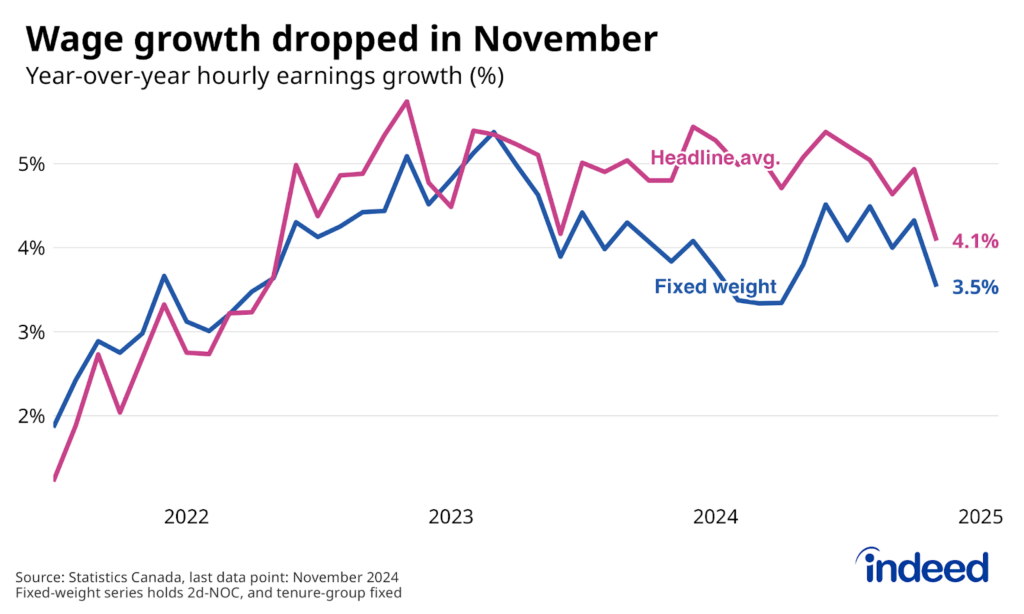
Strong wage growth, the last remnant of the tight post-pandemic labour market, showed further signs of fading. Year-over-year growth in average hourly earnings dipped below 4% for the first time since mid-2022. This easing has been a long time coming, as the underlying ingredients driving solid nominal pay gains have all been receding. The good news (for now) is that inflation has cooled even more. But advertised wages and salaries advertised on Indeed job postings have slowed to 3.0% year-over-year, slower than recent pay growth in LFS, which could be a sign of further easing to come. 

Line graph titled “Wage growth eased again in December” shows the pace of year-over-year wage growth in the LFS between July 2021 and December 2024, with different coloured lines representing headline average wage growth and fixed-weight wage growth. Headline average wage growth has slipped over the past two months to 3.8%.